


Learn Trading for Free and Without Registration
An Online Glossary to Study Trading Independently
Average Directional Movement Index
Average Directional Index (ADX)
The Average Directional Index (ADX) is a technical analysis indicator developed by J. Welles Wilder. It is used to measure trend strength and determine whether the market is trending or moving sideways. ADX helps traders make informed decisions about entering or exiting the market.
How Does ADX Work?
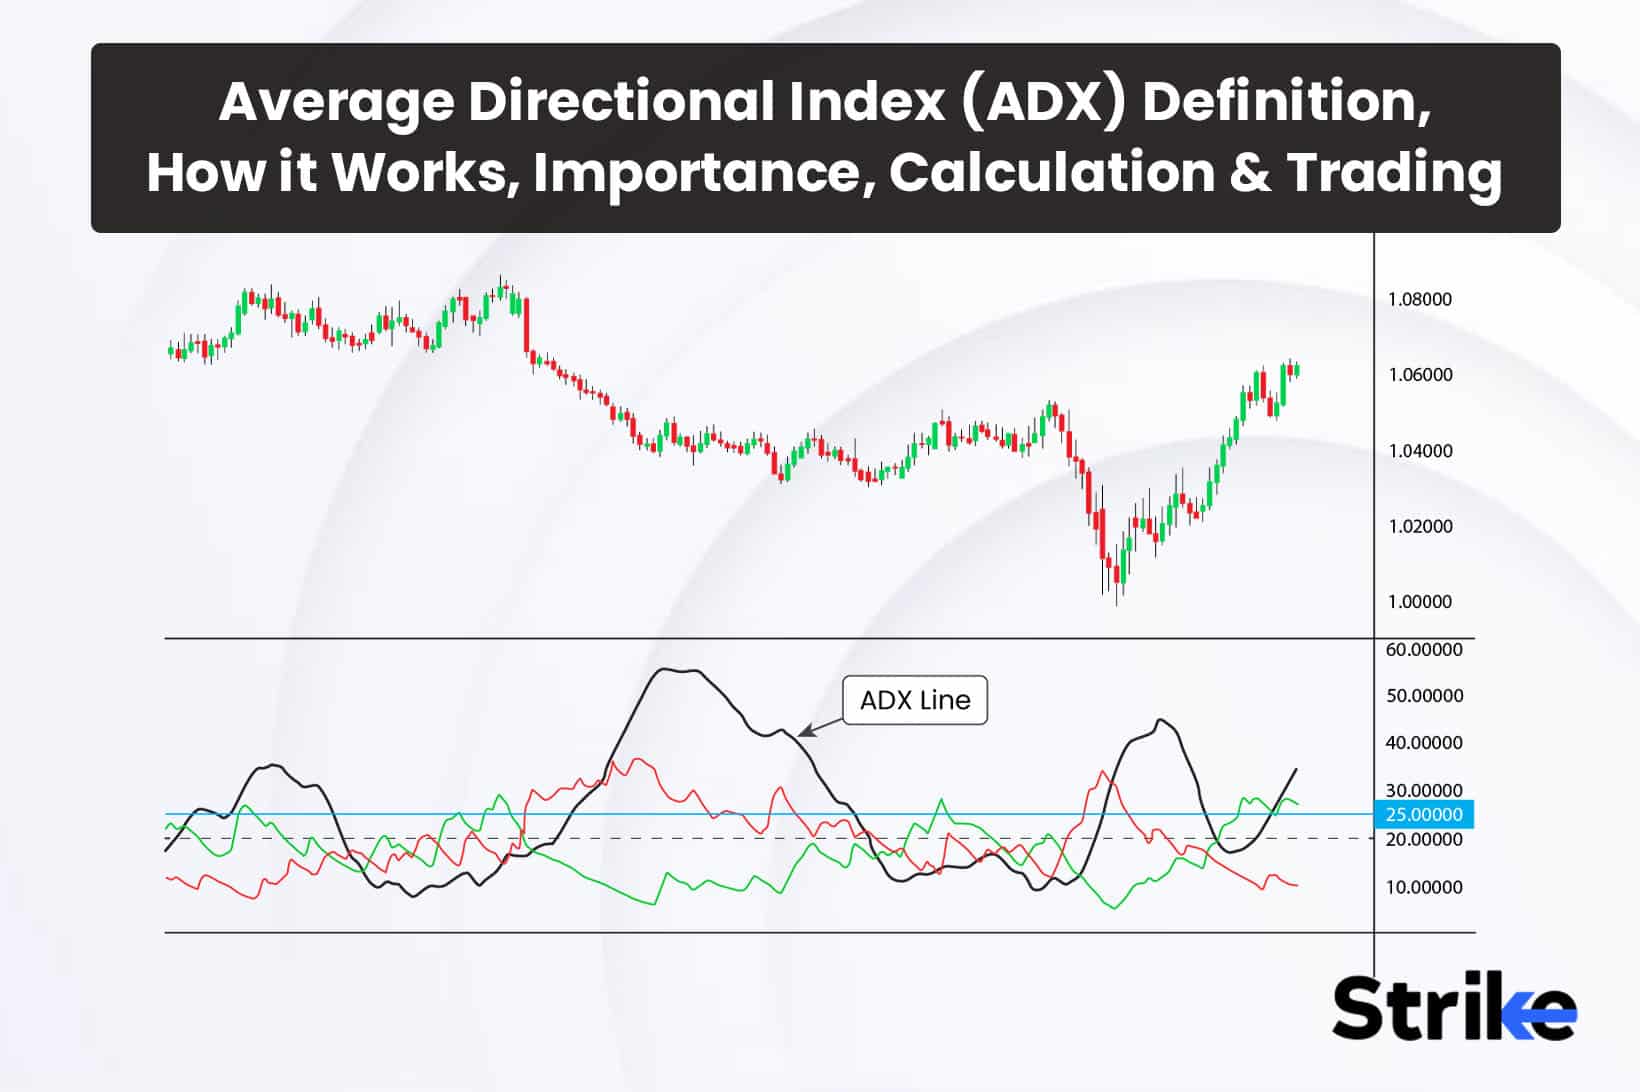
The ADX indicator consists of three lines:
- ADX: Indicates the strength of the trend without showing its direction.
- +DI (Positive Directional Indicator): Shows the strength of upward movement.
- –DI (Negative Directional Indicator): Shows the strength of downward movement.
ADX Calculation Formula
ADX=100×EMA(DMATR)ADX = 100 \times EMA\left(\frac{\text{DM}}{\text{ATR}}\right)
Where:
- DM (Directional Movement): The difference between current and previous highs/lows.
- ATR (Average True Range): A measure of price volatility.
How to Interpret ADX?
1. ADX Values
- 0–25: Weak or no trend. The market is in a range.
- 25–50: Moderately strong trend.
- 50–75: Strong trend.
- 75–100: Very strong trend (rare).
2. +DI and –DI Interaction
- +DI above –DI: Indicates an uptrend.
- –DI above +DI: Indicates a downtrend.
3. ADX as a Trend Strength Indicator
- Rising ADX indicates strengthening trend momentum.
- Falling ADX suggests a weakening trend, even if the price continues in the same direction.
ADX Settings
Period
- The standard period for ADX is 14.
- Shorter periods make the indicator more sensitive but may increase false signals.
- Longer periods smooth the data but can delay signals.
ADX Signals and Trading Strategies
1. Identifying Trend Strength
- ADX above 25 indicates a trending market, providing trading opportunities.
- ADX below 25 suggests a range-bound market. In such cases, oscillators like RSI or Stochastic may be more effective.
2. +DI and –DI Crossovers
- Bullish Signal: +DI crosses above –DI.
- Bearish Signal: –DI crosses above +DI.
3. Confirming Trend Strength
- Uptrend: +DI is above –DI, and ADX is rising.
- Downtrend: –DI is above +DI, and ADX is rising.
4. Combining ADX with Other Indicators
- Moving Averages: Use ADX to confirm the strength of trends identified with moving averages.
- MACD: Use MACD to filter false signals and validate trend reversals.
Advantages of ADX
- Measures Trend Strength: Provides insight into whether the market is trending or ranging.
- Versatility: Works on all timeframes and markets, including Forex, cryptocurrencies, stocks, and commodities.
- Multifunctionality: Can be used as a standalone indicator or in combination with others.
Disadvantages of ADX
- Lagging Indicator: Since ADX is based on moving averages, its signals are delayed.
- Ineffective in Ranging Markets: ADX may produce false signals during periods of consolidation.
- Complexity: Interpreting ADX signals can be challenging for beginners.
Example of Trading with ADX
Scenario:
On an EUR/USD chart, ADX rises above 25, signaling the start of a trend. +DI crosses above –DI, confirming upward momentum. A trader opens a long position and holds it until ADX starts to decline, indicating the trend is losing strength.
Conclusion
The Average Directional Index (ADX) is a robust tool for assessing trend strength. It is particularly effective for trend trading, helping traders identify optimal entry and exit points. However, like any indicator, ADX is not foolproof and should be combined with other technical analysis tools for maximum effectiveness.