


Learn Trading for Free and Without Registration
An Online Glossary to Study Trading Independently
Head and Shoulders Pattern
Head and Shoulders Pattern in Technical Analysis
The Head and Shoulders pattern is one of the most well-known and reliable tools in technical analysis, helping traders identify potential trend reversals. Its popularity stems from its high accuracy when the pattern is correctly formed.
In this article, we’ll take a detailed look at what the Head and Shoulders pattern is, how to identify, build, and use it in trading, as well as when it might not be effective.
What is the Head and Shoulders Pattern?
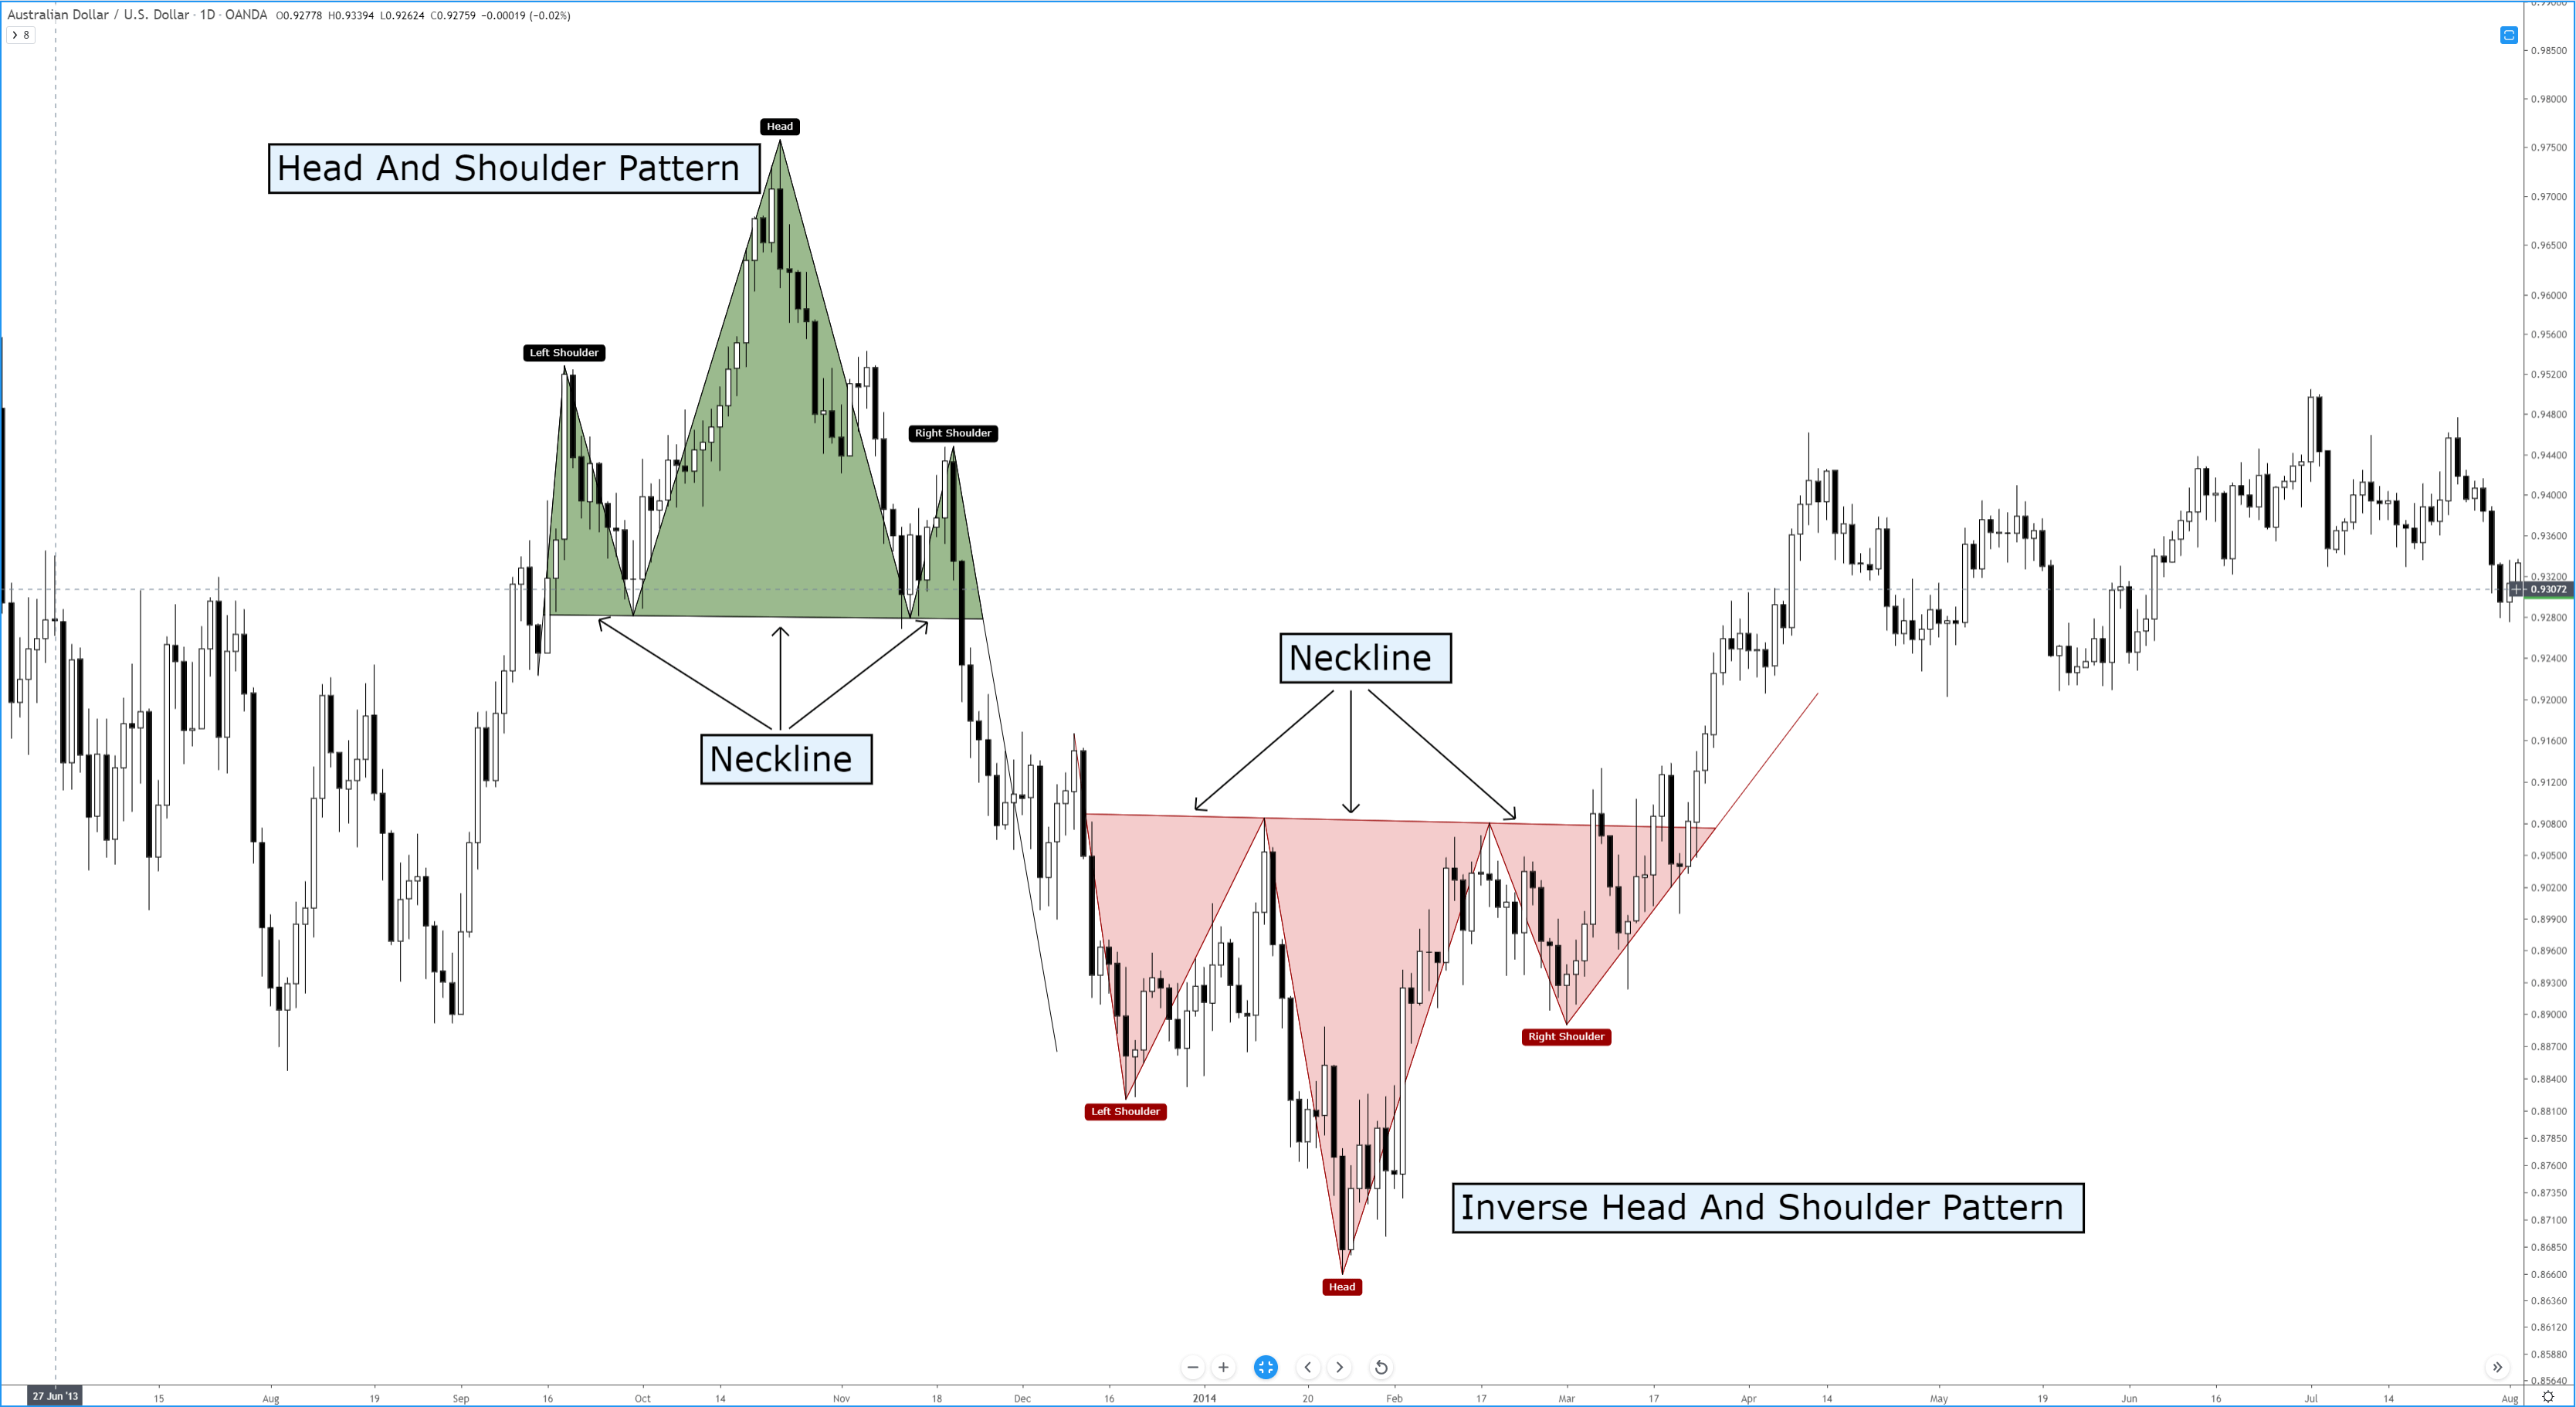
The Head and Shoulders pattern is a reversal formation that typically appears at the peak of an uptrend. It consists of three key elements:
1.Left Shoulder: The first upward price movement followed by a correction.
2.Head: A higher peak, followed by another correction.
3.Right Shoulder: A smaller upward move that does not surpass the height of the head.
All three peaks are connected by a neckline, which links the lows after each upward movement. This neckline is a crucial level for determining the entry point.
How to Identify the Head and Shoulders Pattern?
To identify this pattern on a chart, follow these steps:
1.Determine the trend: Ensure the market is in an uptrend.
2.Spot the three peaks: Identify the left shoulder, head, and right shoulder. The head should be higher than the shoulders, which are roughly the same height.
3.Draw the neckline: Connect the two lows after the first and second peaks. This line serves as the entry signal.
How to Build the Head and Shoulders Pattern?
Once you’ve identified the key points of the pattern, follow these steps:
1.Define the neckline: Use a horizontal or slightly sloping line to connect the lows.
2.Monitor volumes: During the formation of the head, volumes often increase, while on the right shoulder, they typically decline.
3.Wait for the breakout: The price should break below the neckline to confirm the reversal.
When to Use the Head and Shoulders Pattern?
1.During an uptrend: This pattern signals the end of the trend and the beginning of a downward movement.
2.After breakout confirmation: Wait for the price to cross the neckline with increased volume to avoid false signals.
3.On larger timeframes: Daily or four-hour charts provide more accurate signals.
When Not to Use the Head and Shoulders Pattern?
1.In a flat market: The pattern loses effectiveness in a sideways market where there’s no clear trend.
2.With weak volumes: If the neckline break occurs without an increase in volume, it might be a false signal.
3.On lower timeframes: Smaller timeframes, such as M1 or M5, often generate noise, making the pattern less reliable.
Variants of the Head and Shoulders Pattern
1.Inverse Head and Shoulders:
This variation appears during a downtrend and signals a reversal upward. The structure remains the same but is oriented in the opposite direction.
2.Complex Head and Shoulders:
The pattern may include additional peaks or troughs, making it more challenging to interpret while adhering to the core concept.
Why is the Head and Shoulders Pattern Effective?
1.High accuracy: When identified correctly, the probability of a successful trade is significantly higher.
2.Clear signals: The neckline provides a definitive entry point, while the distance from the head to the neckline suggests the potential profit target.
3.Versatility: This pattern works across all financial markets, including Forex, stocks, and cryptocurrencies.
Drawbacks of the Head and Shoulders Pattern
1.Difficulty in identification: On volatile markets, the pattern may be hard to distinguish due to excessive price fluctuations.
2.False signals: Sometimes, a neckline breakout can be temporary.
3.Trend dependency: The pattern is ineffective without a strong preceding trend.
How to Enhance the Effectiveness of the Pattern?
1.Combine with indicators: Use RSI, MACD, or ADX for confirmation.
2.Analyze volumes: An increase in volume during the neckline breakout strengthens the signal.
3.Practice: Familiarize yourself with the pattern on historical charts to understand its behavior.
Conclusion
The Head and Shoulders pattern is a powerful tool for identifying trend reversals with high accuracy. Despite its drawbacks, it remains one of the most popular patterns in technical analysis.
To achieve success, use this pattern alongside other analytical tools and always adhere to risk management principles. Remember: discipline and practice are key to mastering trading!