Learn Trading for Free and Without Registration
An Online Glossary to Study Trading Independently
Trend Continuation Patterns in Forex
Trend Continuation Patterns in Financial Markets
Trend continuation patterns are essential tools in technical analysis that allow traders to predict the continuation of an existing market trend after a period of consolidation or pause. Unlike reversal patterns, which indicate potential changes in price direction, continuation patterns suggest that the current trend is likely to persist.
These patterns are applicable across various financial markets, including Forex, stock markets, commodities, and cryptocurrencies. However, their effectiveness heavily depends on market conditions. For instance, they perform best in low-volatility environments or during periods when significant fundamental events are not impacting price movements.
What Are Trend Continuation Patterns?
Trend continuation patterns are chart formations that occur during periods of market consolidation, signaling that the price is likely to resume its current trend after the pause. These patterns represent the market “recharging” before making the next significant move.
Continuation patterns appear in both bullish and bearish markets, helping traders avoid premature exits from positions and providing opportunities to rejoin the trend.
When and Where Do Trend Continuation Patterns Work Best?
1.Low Volatility Markets: These patterns are most effective when the market is not experiencing significant price spikes. For instance, in Forex, they work well during less active sessions, like the Asian trading session.
2.Markets Without Fundamental Events: Major news, such as central bank decisions or economic reports, can disrupt the formation of these patterns, leading to invalid signals.
3.Stock and Commodity Markets: Continuation patterns often emerge during stable trends, such as a bull run in stocks or a consistent decline in commodity prices.
Key Trend Continuation Patterns
1.Flag:
This pattern resembles a slanted rectangle or parallelogram, forming after a strong impulse move. The price moves within a channel, then breaks out in the direction of the original trend.
2.Pennant:
Similar to a flag, but with converging trendlines that create a triangle shape. Pennants often signal a continuation of the trend after a breakout.
3.Triangle:
Includes ascending, descending, and symmetrical triangles. Each type indicates a likely continuation of the trend once the price breaks out.
4.Wedge:
A slanted pattern with converging trendlines. Wedges can be rising or falling and generally take longer to form than flags or pennants.
5.Rectangle:
This pattern forms when the price oscillates between horizontal support and resistance levels. A breakout from the range in the direction of the original trend confirms the continuation.
How Do Trend Continuation Patterns Work?
1.Consolidation Phase: The pattern begins to form after a significant impulse move, indicating that the market is “resting.”
2.Breakout: Once the consolidation ends, the price breaks out in the direction of the main trend.
3.Trading Signals: Traders often look for confirmation, such as volume spikes or additional indicators (e.g., MACD or RSI), to validate the breakout.
Advantages of Using Trend Continuation Patterns
1.Ease of Interpretation: These patterns are relatively simple to identify on charts, making them accessible to traders of all levels.
2.Versatility: They work across various markets and timeframes, from minute charts to daily ones.
3.High Probability: When identified correctly, these patterns provide reliable entry and exit signals.
Risks of Using Trend Continuation Patterns
1.Impact of News: Fundamental events can disrupt patterns, leading to false breakouts.
2.Misinterpretation: Incorrectly identifying patterns can result in poor trading decisions.
3.High Volatility Markets: In such conditions, patterns often produce false signals due to erratic price movements.
Conclusion
Trend continuation patterns are a powerful tool for traders aiming to capitalize on existing market trends. However, they require careful analysis and additional confirmations to minimize risks.
Use these patterns in low-volatility markets, avoid trading during fundamental events, and always be aware of the risks involved. Success with these patterns depends on your ability to interpret market signals and your willingness to refine your trading strategy through experience.
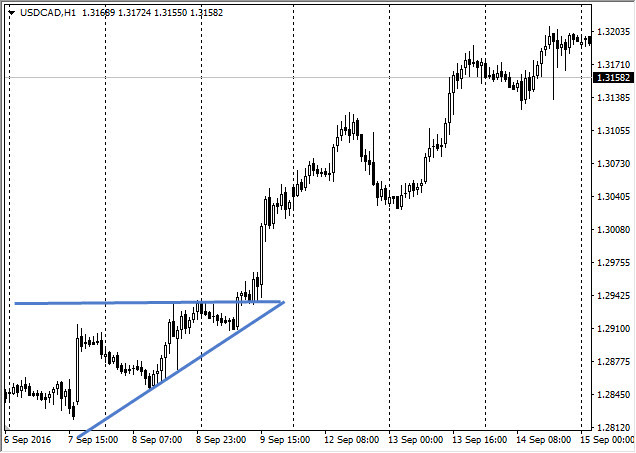
Figure 1. Rising triangle pattern.
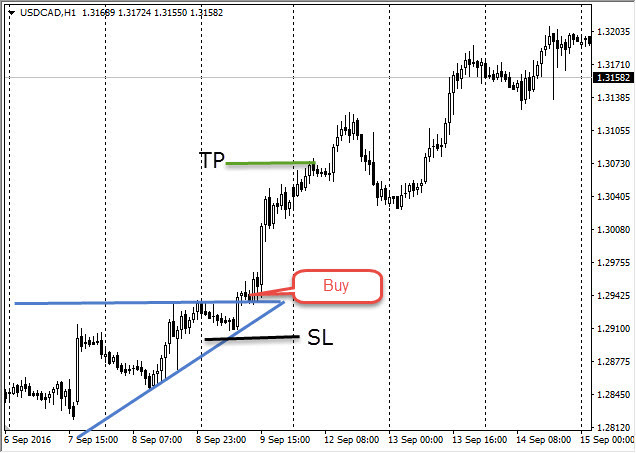
Figure 2. Entry point on the chart.
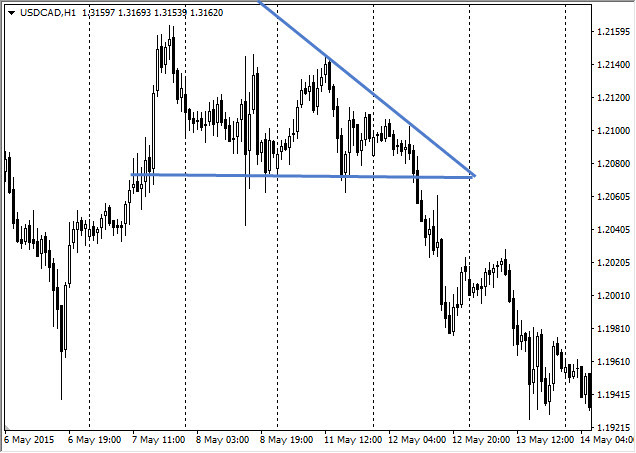
Figure 3. Example of a falling triangle.
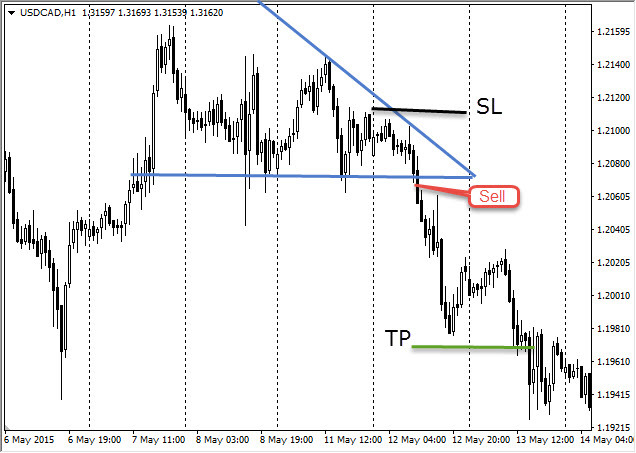
Figure 4. Entry point on the chart.
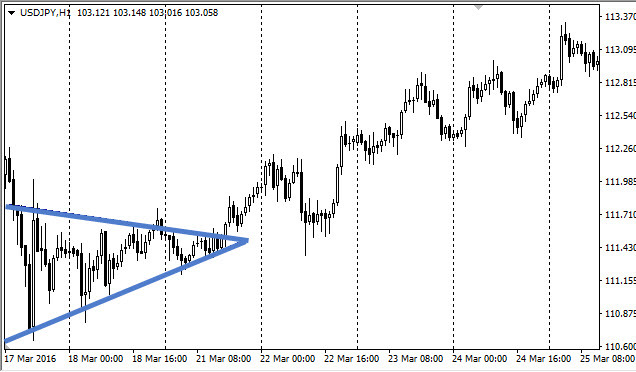
Figure 5. Example of a symmetrical triangle.
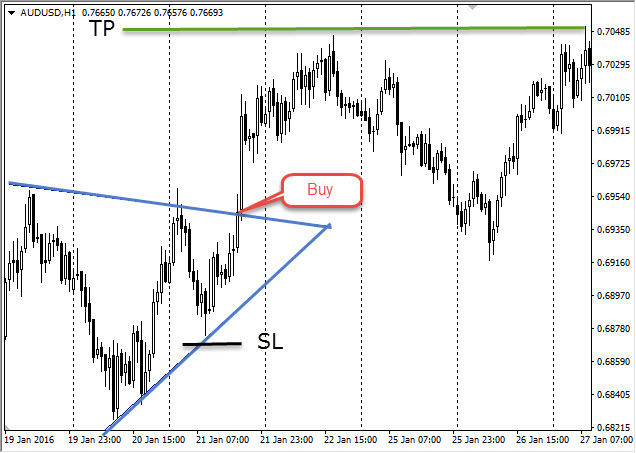
Figure 6. Entry point on the chart.


