


Learn Trading for Free and Without Registration
An Online Glossary to Study Trading Independently
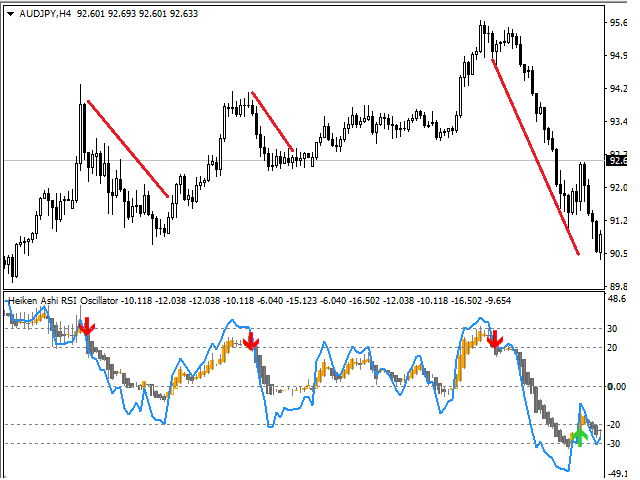
Relative Strength Index Indicator description

What is RSI and How to Use It Effectively in Your Trading Strategy
The Relative Strength Index (RSI) is one of the most popular tools in technical analysis, widely used to identify overbought and oversold conditions in the market. This article will explore RSI in detail, including its calculation, applications, and how to integrate it into a robust trading strategy.
What is RSI?
The RSI is an oscillator that measures the speed and change of price movements on a scale of 0 to 100. Developed by J. Welles Wilder in 1978, RSI has become a staple indicator for traders across Forex, stocks, and other financial markets.
RSI works by comparing the average of gains to the average of losses over a specified period (commonly 14 periods). It helps traders assess the strength or weakness of a price trend.
Key RSI Levels:
- 70 or above: Indicates overbought conditions and a potential reversal downward.
- 30 or below: Indicates oversold conditions and a potential reversal upward.
- 50: Represents a neutral level, often used as a dividing line between bullish and bearish momentum.
How to Calculate RSI
The formula for RSI is:
RSI=100−1001+RSRSI = 100 - \frac{100}{1 + RS}
Where:
- RS = Average Gain over N periods / Average Loss over N periods.
For example, with a 14-period RSI:
- Calculate the average gains and losses over the last 14 periods.
- Divide the average gain by the average loss to find RS.
- Plug RS into the RSI formula to get the final value.
Fortunately, modern trading platforms calculate RSI automatically, so you don’t need to do it manually.
Using RSI in Your Trading Strategy
1. Identifying Overbought and Oversold Conditions
- When RSI exceeds 70, it suggests that the asset may be overbought and due for a correction.
- When RSI falls below 30, it indicates oversold conditions and a potential reversal upward.
2. Spotting Divergences
- Bullish Divergence: When price forms lower lows, but RSI forms higher lows, it signals a potential reversal upward.
- Bearish Divergence: When price forms higher highs, but RSI forms lower highs, it signals a potential reversal downward.
3. Trend Confirmation
- RSI values above 50 suggest bullish momentum.
- RSI values below 50 indicate bearish momentum.
4. Dynamic Support and Resistance
In trending markets, RSI often respects certain levels:
- During an uptrend, RSI tends to stay above 40 and often bounces around 50-60.
- During a downtrend, RSI tends to stay below 60 and often dips around 40-30.
Creating a Strategy with RSI
Step 1: Define Your Goal
Let’s say you’re interested in swing trading, aiming to capture short-to-medium-term price movements.
Step 2: Choose RSI Settings
The default RSI period is 14, but for shorter timeframes, you can try 9 or 10 periods for faster signals.
Step 3: Combine with Other Indicators
- With Moving Averages: Use a 50-period SMA to identify the trend direction. Combine this with RSI to time entries and exits.
- With Bollinger Bands: RSI can confirm overbought or oversold conditions when price hits the upper or lower band.
Step 4: Define Entry and Exit Rules
- Entry Rules:
- Enter a long position when RSI crosses above 30 and price is near a support level.
- Enter a short position when RSI crosses below 70 and price is near a resistance level.
- Exit Rules:
- Close the trade when RSI crosses back to the neutral zone around 50.
- Set a stop-loss at recent price extremes to manage risk.
Step 5: Backtest and Optimize
Use historical data to test your RSI-based strategy. Adjust parameters, such as RSI period or additional indicators, to improve performance.
Advanced Tips for Using RSI
- Experiment with Custom Levels: Instead of the default 70/30, try 80/20 for stronger trends or 60/40 for range-bound markets.
- Use RSI with Multiple Timeframes: Analyze RSI on higher timeframes for overall trend direction and on lower timeframes for precise entry points.
- Avoid Using RSI in Isolation: Always confirm signals with price action or other indicators to reduce false signals.
Advantages and Disadvantages of RSI
Advantages:
- Versatility: Works across all markets and timeframes.
- Simplicity: Easy to interpret and apply.
- Divergences: A powerful tool for spotting potential reversals.
Disadvantages:
- False Signals: RSI can give misleading signals in highly volatile or range-bound markets.
- Lagging Nature: Like most indicators, RSI is based on past data, which may delay its responsiveness to rapid market changes.
Conclusion
The Relative Strength Index is a powerful and versatile tool that can enhance any trading strategy. Whether you’re a day trader or a swing trader, RSI provides valuable insights into market momentum and potential reversals.
To maximize its effectiveness:
- Combine RSI with other indicators such as moving averages, Bollinger Bands, or MACD.
- Customize its settings to match your trading style and market conditions.
- Continuously backtest and refine your strategy to adapt to changing market dynamics.
With practice and discipline, RSI can become an indispensable part of your trading arsenal.