


Learn Trading for Free and Without Registration
An Online Glossary to Study Trading Independently
How to use the Ichimoku Kinko Hyo indicator?
What is the Ichimoku Kinko Hyo Indicator and How to Use It?
Ichimoku Kinko Hyo is a comprehensive technical analysis tool developed in Japan in the mid-20th century by analyst Goichi Hosoda. Its name translates to "one glance equilibrium chart," emphasizing its ability to provide a clear market overview at a single glance. This indicator is used to determine trend direction, support and resistance levels, and market dynamics. Its versatility allows traders to use it as a standalone tool or in combination with other indicators.
Components of Ichimoku Kinko Hyo
The indicator consists of five main lines and a "cloud" (Kumo) that collectively create a comprehensive market picture:
-
Tenkan-sen (Conversion Line):
- Calculated as the average of the highest high and lowest low over the last 9 periods.
- Reflects short-term price movement.
- Formula: Tenkan-sen=High(9)+Low(9)2\text{Tenkan-sen} = \frac{\text{High(9)} + \text{Low(9)}}{2}
-
Kijun-sen (Base Line):
- The average of the highest high and lowest low over the last 26 periods.
- Shows medium-term trend direction and often acts as support or resistance.
- Formula: Kijun-sen=High(26)+Low(26)2\text{Kijun-sen} = \frac{\text{High(26)} + \text{Low(26)}}{2}
-
Senkou Span A (Leading Span A):
- The average of Tenkan-sen and Kijun-sen, projected 26 periods ahead.
- Formula: Senkou Span A=Tenkan-sen+Kijun-sen2\text{Senkou Span A} = \frac{\text{Tenkan-sen} + \text{Kijun-sen}}{2}
-
Senkou Span B (Leading Span B):
- The average of the highest high and lowest low over the last 52 periods, projected 26 periods ahead.
- Formula: Senkou Span B=High(52)+Low(52)2\text{Senkou Span B} = \frac{\text{High(52)} + \text{Low(52)}}{2}
-
Chikou Span (Lagging Line):
- The current price shifted 26 periods back.
- Helps confirm trend direction.
How to Use Ichimoku Kinko Hyo
1. Identifying Trends
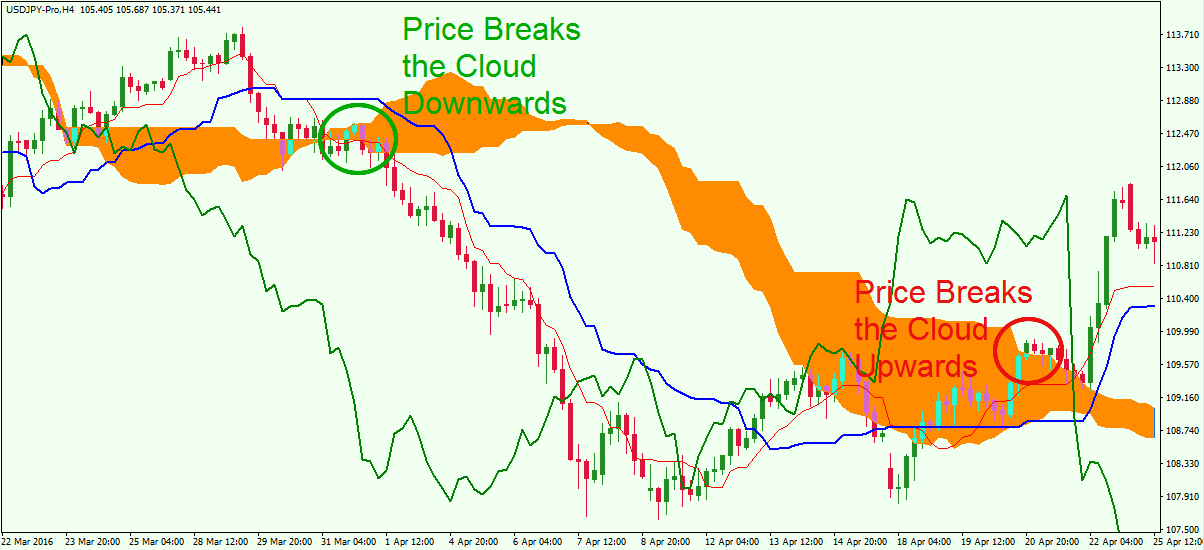
- Bullish Trend: The price is above the cloud (Kumo).
- Bearish Trend: The price is below the cloud.
- Sideways Market: The price is moving within the cloud.
2. Kumo as Support and Resistance
- The upper and lower boundaries of the cloud act as dynamic support and resistance levels.
- The cloud expands with increasing volatility, strengthening its role as a barrier.
3. Tenkan-sen and Kijun-sen Crossovers
- Golden Cross: Tenkan-sen crosses Kijun-sen from below, signaling a buy opportunity.
- Death Cross: Tenkan-sen crosses Kijun-sen from above, signaling a sell opportunity.
4. Using Chikou Span
- If the Chikou Span is above the price chart, it confirms an uptrend.
- If it is below, it indicates a downtrend.
Ichimoku Signals
-
Strong Signals:
- Crossovers occur outside the cloud.
- Price is far from the cloud, indicating a strong trend.
-
Weak Signals:
- Crossovers occur inside the cloud.
- Price nears the cloud, signaling uncertainty.
Ichimoku Kinko Hyo Settings
The default parameters are 9, 26, and 52. However, traders can adjust them to suit their strategies. For example:
- 9, 26, 52: Suitable for long-term trading.
- 7, 22, 44: Often used for more volatile markets like cryptocurrencies.
Advantages of Ichimoku Kinko Hyo
- Versatility: It can identify trends, support/resistance levels, and reversals.
- Visualization: The Kumo cloud provides a clear picture of market conditions.
- Applicability: Works across various timeframes and markets.
Disadvantages of Ichimoku Kinko Hyo
- Complexity: It can be overwhelming for beginners.
- Lag: Like many indicators, it is based on historical data.
- Limited use in sideways markets: It may produce false signals in ranging conditions.
Example of Using Ichimoku Kinko Hyo
Scenario:
On a daily USD/JPY chart, the price moves above the cloud, and Tenkan-sen crosses Kijun-sen from below. The Chikou Span is above the price. This provides a strong buy signal. A trader can enter the market with a stop-loss below the cloud boundary.
Conclusion
Ichimoku Kinko Hyo is a powerful and versatile indicator that provides comprehensive market insights. It is particularly effective for trend trading. However, like any tool, it is best used in conjunction with other indicators or analysis methods.