Learn Trading for Free and Without Registration
An Online Glossary to Study Trading Independently
Bollinger Bands
Bollinger Bands: Application, Mistakes, and Recommendations

Bollinger Bands, developed by John Bollinger in the 1980s, are a versatile technical analysis tool designed to measure market volatility. They provide traders with a framework for analyzing price movements and identifying market conditions. Widely available in most trading platforms, Bollinger Bands are used across forex, stock, commodity, and cryptocurrency markets. However, like any tool, they have their strengths and limitations.
How to Use Bollinger Bands
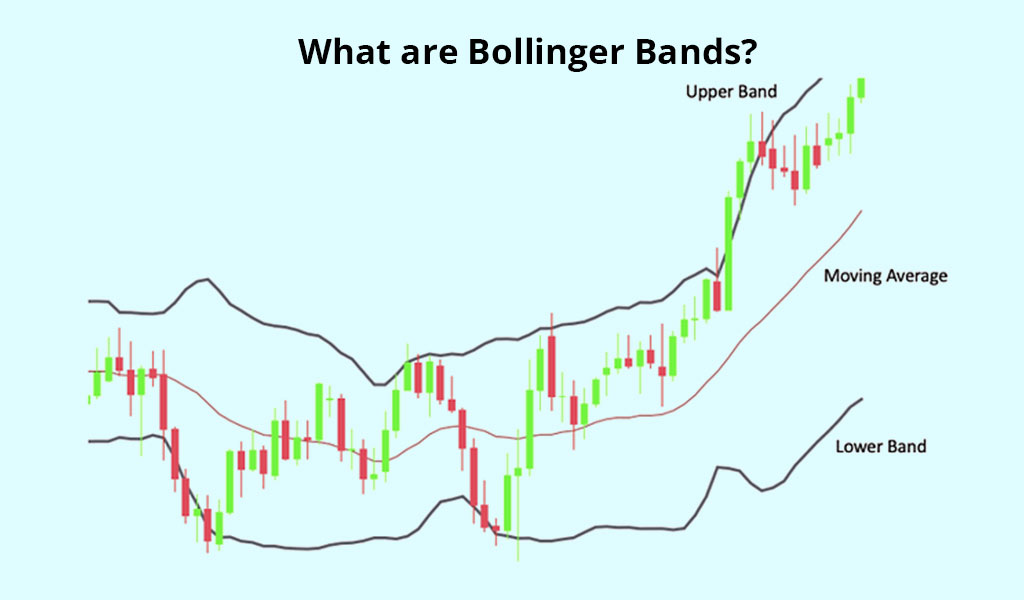
Bollinger Bands consist of three lines:
- The Middle Line (SMA): A simple moving average that represents the overall trend.
- The Upper and Lower Bands: These are deviations from the middle line, adjusted based on volatility.
The indicator works in three primary scenarios:
1. Trend Trading
- In a strong trend, the price often stays near the outer bands.
- Uptrend: The price moves along the upper band, with the middle line acting as dynamic support.
- Downtrend: The price moves along the lower band, with the middle line serving as resistance.
2. Range Trading
- During sideways markets, the price oscillates between the upper and lower bands.
- The upper band acts as resistance, while the lower band serves as support.
- This is ideal for trading reversals at the band boundaries.
3. Breakout Trading
- A sharp expansion of the bands signals increased volatility.
- A breakout above or below the bands may indicate the start of a new trend.
Common Mistakes When Using Bollinger Bands
-
Ignoring Market Context
- Bollinger Bands are more effective in trending markets. Using them in a range-bound market without additional context can lead to false signals.
-
Assuming Bands Are Absolute Levels
- The upper and lower bands are not fixed levels of support and resistance. Prices can remain outside the bands during strong trends.
-
Relying Solely on Breakout Signals
- A breakout beyond the bands doesn't always signify the start of a trend. It can often be a false signal, particularly in low-volatility conditions.
-
Lack of Confirmation Tools
- Using Bollinger Bands without supplementary indicators like RSI, MACD, or Stochastic can lead to higher error rates.
Recommendations for Using Bollinger Bands
-
Combine with Other Indicators
- Bollinger Bands work best when paired with oscillators like RSI or Stochastic, which help confirm reversals or trend continuations.
-
Adjust the Settings
- Default settings (period 20, deviation 2) suit most markets but may require adjustments:
- For high-volatility markets (e.g., cryptocurrencies): Increase the period and deviation for smoother signals.
- For low-volatility assets: Decrease the settings for greater sensitivity.
- Default settings (period 20, deviation 2) suit most markets but may require adjustments:
-
Select the Right Market
- Forex: Effective on medium timeframes (H1-H4), especially during Asian and European sessions.
- Stock Market: Less reliable due to sudden news-driven spikes causing frequent false breakouts.
- Cryptocurrencies: Requires adjusted settings due to high volatility.
- Commodities: Works well during moderate trends but less effective during seasonal fluctuations.
Advantages of Bollinger Bands
- Adapts to current market volatility.
- Versatile for various markets and timeframes.
- Suitable for trend, range, and breakout strategies.
Disadvantages of Bollinger Bands
- Does not provide explicit entry or exit signals.
- Prone to false signals during low-volatility periods.
- Requires complementary indicators for effective use.
Conclusion
Bollinger Bands are a powerful tool that can form the backbone of a trading strategy. However, their effectiveness depends on your ability to adapt settings to market conditions and combine them with other indicators. Learning from historical behavior and testing different approaches is crucial for mastering their use.
Experiment, analyze, and make Bollinger Bands a reliable part of your trading arsenal!


