


Learn Trading for Free and Without Registration
An Online Glossary to Study Trading Independently
Rectangles
Rectangle Pattern in Technical Analysis
The rectangle pattern is one of the simplest and most intuitive tools in technical analysis, enabling traders to analyze the market effectively. Its popularity stems from its ease of identification and versatility, making it suitable for any financial market.
What is the Rectangle Pattern?
A rectangle is a price formation that occurs during periods of consolidation, where the market moves within two horizontal lines: a support level and a resistance level.
These levels remain static while the price moves “locked” between them. Rectangles are often observed on hourly (H1) or four-hour (H4) timeframes, as these intervals provide a clearer picture of price movements.
How Does the Rectangle Pattern Work?
The functionality of the rectangle pattern is similar to the analysis of indicators that form price channels, such as Bollinger Bands. However, there is a key difference:
•Price channels: Adjust dynamically to price movements, adapting to market conditions.
•Rectangle pattern: Relies on static levels, disregarding the current trend.
This allows traders to focus exclusively on support and resistance levels without considering overall trend direction.
How to Identify a Rectangle Pattern?
1.Define the support level: Identify the lower level where the price repeatedly finds support and bounces upward.
2.Define the resistance level: Identify the upper level where the price repeatedly faces resistance and moves downward.
3.Verify the consolidation: Ensure that the price moves consistently between these levels over a period of time.
On a chart, the rectangle appears as a horizontal range with clearly defined boundaries.
How to Trade Using the Rectangle Pattern?
1. Trading Within the Rectangle
When the price is moving inside the range, traders can use the boundaries for trading:
•Buy: When the price nears the support level, signaling a potential upward bounce.
•Sell: When the price approaches the resistance level, indicating a potential downward reversal.
Tip: Always use confirming signals, such as candlestick patterns or indicators like RSI or Stochastic, to improve accuracy.
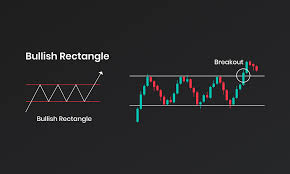
2. Trading the Breakout
A rectangle often precedes a significant market move. A breakout of either boundary can signal the start of a new trend:
•Breakout Upward: Indicates the continuation or reversal of an uptrend.
•Breakout Downward: Signals the continuation or reversal of a downtrend.
Tip: Wait for breakout confirmation, such as increased trading volume or a candlestick close beyond the boundary, before entering a trade.
Why is the Rectangle Pattern Effective?
1.Simplicity: Easy to identify on a chart, even without complex indicators.
2.Versatility: Works across all markets—Forex, stock, commodity, and cryptocurrency markets.
3.Reliability: Support and resistance levels form the foundation of technical analysis.
4.Flexibility: Suitable for both range trading and breakout strategies.
When Might the Rectangle Pattern Be Ineffective?
1.High Volatility: In highly volatile markets, prices may frequently break through levels, creating false signals.
2.Fundamental Events: Important news or economic reports can disrupt market dynamics, rendering static levels ineffective.
3.Extended Consolidation: Prolonged periods within the range may reduce market interest and trade opportunities.
Advantages of Using the Rectangle Pattern in Market Analysis
1.Trend-Independent Analysis: Focuses on horizontal levels, eliminating noise from trends.
2.Applicable to Any Market: Equally effective on Forex, stock markets, cryptocurrency, and commodities.
3.Accurate Signals: Clearly defined boundaries make decision-making easier.
Conclusion
The rectangle pattern is a foundational tool in technical analysis that every trader should master. Its simplicity and reliability make it an ideal choice for both novice and experienced traders.
However, like any tool, the rectangle pattern requires caution and a comprehensive approach. Always combine it with other analytical methods and manage your risks carefully. Wishing you success and profitable trades!