Learn Trading for Free and Without Registration
An Online Glossary to Study Trading Independently
Collection of Candlestick Patterns. Cheat Sheet
Cheat Sheet on Candlestick Patterns: A Guide for Traders
Welcome to our cheat sheet section, dedicated to candlestick patterns! Here, we’ve compiled the key candlestick patterns that traders can use as additional tools for analysis. However, before diving into the details, let’s clarify an important point: candlestick patterns are not a universal key to success. They are useful as guides and hints but should not be relied upon as the sole source of information.
Why Candlestick Patterns Are Not the Ultimate Tool
Candlestick patterns have gained popularity due to their visual simplicity and long history. They allow traders to evaluate price behavior over a specific period and sometimes predict future movements. However, like any analytical tool, they come with limitations:
-
Ambiguity in interpretation.
The same candlestick pattern can suggest different scenarios depending on the market context. For example, a "hammer" on one chart might indicate a reversal, while on another, it could be a false signal. -
Dependence on other factors.
Candlesticks only reflect price movements and don’t account for volume, news, trendlines, or levels. Understanding the market requires integrating multiple types of analysis. -
Less effective in volatile markets.
During significant news events, sharp trends, or chaotic market movements, candlestick patterns often provide false signals as the market becomes unpredictable. -
Subjectivity.
Interpreting candlestick patterns often depends on the trader’s experience. Beginners may misidentify a "hammer" or overlook a critical signal.
How to Use Candlestick Patterns Effectively
While candlestick patterns don’t guarantee precise predictions, they can be helpful when combined with other tools. Here are some tips for using them:
-
Use candlesticks as confirmation tools.
Employ candlestick patterns to confirm your ideas derived from other analysis methods like support and resistance levels, trendlines, or volume indicators. -
Evaluate the market context.
Candlestick patterns don’t work in isolation. Before making decisions, consider the overall trend, volatility, and nearby key levels. For instance, a "hammer" at strong support is more significant than in the middle of a range. -
Follow risk management rules.
Always use stop-loss orders, as even the most reliable patterns can fail. Candlestick patterns should never replace proper risk assessment. -
Backtest on historical data.
Before relying on candlestick patterns in live trading, test them on historical data. This helps you understand how well they work for specific pairs or timeframes.
Candlestick Patterns in Our Cheat Sheet
This cheat sheet contains the most common candlestick patterns to help you navigate candlestick analysis:
-
Reversal Patterns:
- Hammer
- Hanging Man
- Inverted Hammer
- Shooting Star
-
Indecision Patterns:
- Doji
- Spinning Top
-
Trend Patterns:
- White Marubozu
- Black Marubozu
Each pattern includes detailed descriptions, illustrations, and validation criteria, making it easier for you to understand what’s happening on the chart and make informed decisions.
Why Are Candlestick Patterns Less Popular Now?
Although candlestick patterns were once highly favored, their effectiveness has declined over time due to several factors:
-
Rise of automated trading.
Modern algorithmic systems rely on complex calculations and rarely consider candlestick patterns in isolation. -
Evolving market structure.
With the growth of high-frequency trading and increased volatility, candlestick patterns often lose their predictive power. -
Information overload.
Many traders overestimate candlestick patterns, applying them without considering other factors, leading to incorrect conclusions and losses.
Conclusion: A Guide, Not a Foundation
Candlestick patterns are a valuable tool in a trader’s arsenal, but they should not be treated as the foundation of analysis. Use them as a cheat sheet, an additional guide, or a confirmation tool.
In trading, it’s important to understand that no single tool offers 100% accuracy. Success comes from a comprehensive approach, experience, and continuous learning. Our cheat sheet is designed to help you quickly grasp the basics of candlestick analysis and integrate it into your overall strategy.
|
Number of Candlesticks |
Pattern Name | Bullish or Bearish? | What Does It Look Like? |
|---|---|---|---|
| One | Spinning Top | Neutral |  |
| Doji | Neutral | 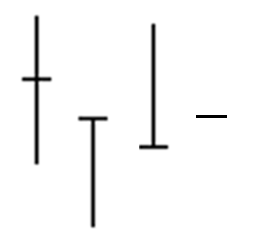 |
|
| White Marubozu | Bullish | 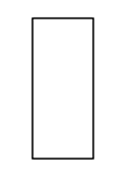 |
|
| Black Marubozu | Bearish |  |
|
| Hammer | Bullish | 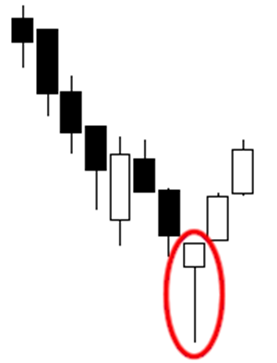 |
|
| Hanging Man | Bearish | 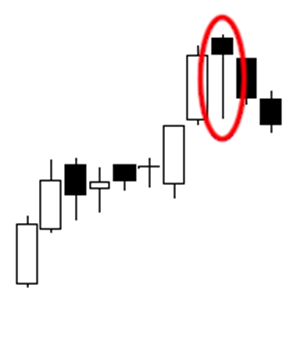 |
|
| Inverted Hammer | Bullish | 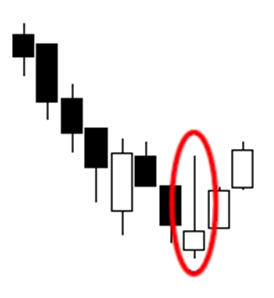 |
|
| Shooting Star | Bearish | 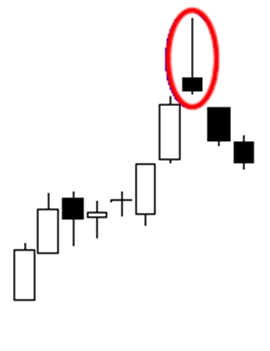 |
|
| Two | Bullish Engulfing | Bullish | 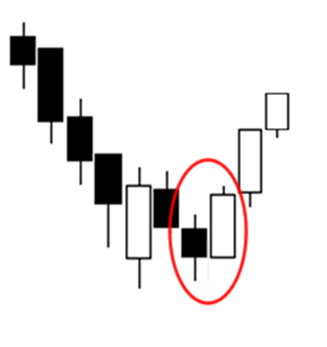 |
| Bearish Engulfing | Bearish | 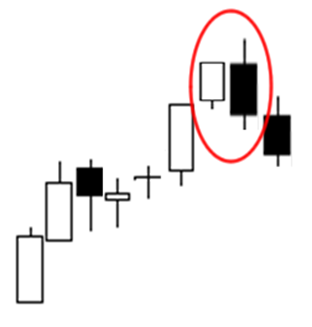 |
|
| Tweezer Tops | Bearish | 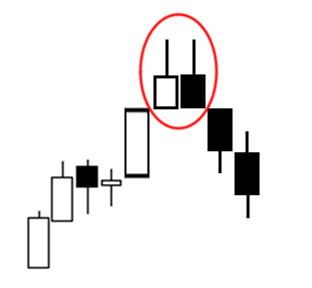 |
|
| Tweezer Bottoms | Bullish | 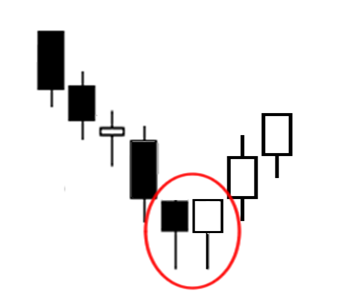 |
|
| Three | Morning Star | Bullish | 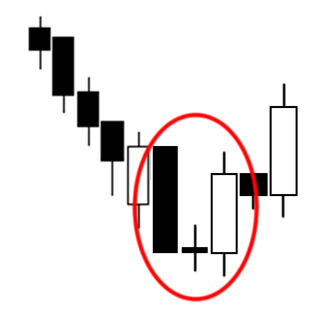 |
| Evening Star | Bearish | 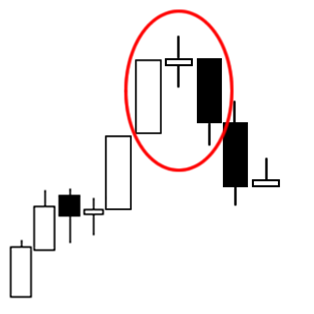 |
|
| Three White Soldiers | Bullish | 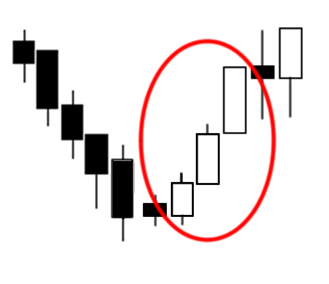 |
|
| Three Black Crows | Bearish | 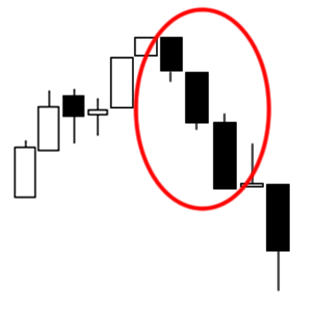 |
|
| Three Inside Up | Bullish | 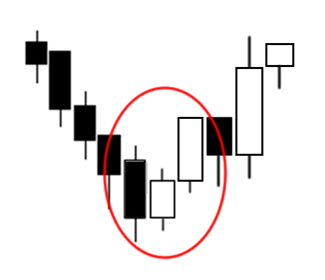 |
|
| Three Inside Down | Bearish | 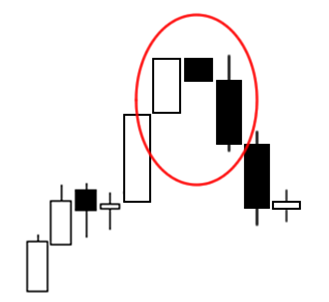 |


