


Learn Trading for Free and Without Registration
An Online Glossary to Study Trading Independently
Stochastic - Forex Indicator
Stochastic Oscillator: A Key Forex Indicator
The Stochastic Oscillator is a popular technical tool used worldwide by traders to analyze the strength and direction of price movements. It’s a vital instrument for identifying overbought and oversold market conditions, as well as potential reversals.
In this article, we’ll cover:
- What the Stochastic Oscillator is;
- How it’s calculated;
- How to use it in practice;
- Its advantages, limitations, and key strategies.
What Is the Stochastic Oscillator?
The Stochastic Oscillator is a momentum indicator that compares a security’s closing price to its price range over a specified period. Developed by George Lane in the 1950s, it’s based on the principle that prices tend to close near their highs in an uptrend and near their lows in a downtrend.
The oscillator is displayed in a separate window on the chart and consists of two lines:
- %K: The main line that reflects current price momentum.
- %D: A signal line, which is a moving average of %K.
Both lines oscillate between 0 and 100, making it easy to interpret, even for beginners.
How Is the Stochastic Oscillator Calculated?
The calculation involves the following steps:
- %K = [(Closing Price - Lowest Low) / (Highest High - Lowest Low)] × 100
- %D: A simple moving average of %K over a specified number of periods.
Example: For a 14-period stochastic, the highest and lowest prices over the last 14 periods are used in the formula.
How to Interpret the Stochastic Oscillator
1. Overbought and Oversold Levels
- A reading above 80 indicates overbought conditions. This suggests the market may be overheated, and a downward reversal could be imminent.
- A reading below 20 indicates oversold conditions. The market may be undervalued, signaling a potential upward reversal.
2. Crossovers
- When the %K line crosses the %D line from above, it generates a sell signal.
- When the %K line crosses the %D line from below, it signals a buy opportunity.
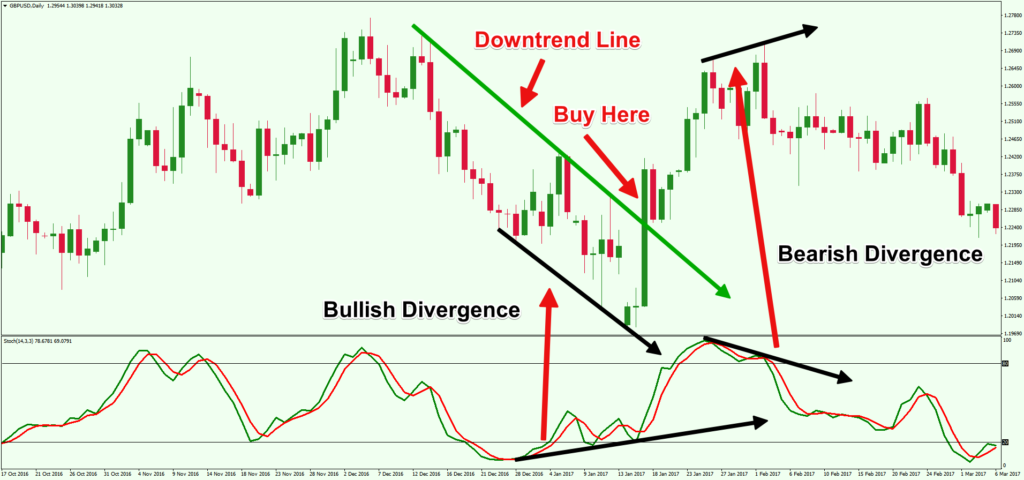
3. Divergence
Divergence between the Stochastic Oscillator and price action can signal reversals:
- Bullish Divergence: Price makes new lows, but the stochastic doesn’t.
- Bearish Divergence: Price makes new highs, but the stochastic fails to follow.
Stochastic Oscillator Settings
Standard settings include:
- %K Periods: Typically 14 periods.
- %D Periods: Usually 3 periods (the signal line).
- Slowing: Often set to 3 for smoothing.
These settings can be adjusted based on your trading style and the timeframe you’re analyzing.
Strategies for Using the Stochastic Oscillator
1. Range Trading
The Stochastic Oscillator performs well in sideways markets:
- Buy when it crosses above 20 from below.
- Sell when it crosses below 80 from above.
2. Trend Following
In trending markets, use the oscillator to find entry points:
- In an uptrend, look for oversold levels below 20.
- In a downtrend, focus on overbought levels above 80.
3. Divergence Signals
Divergence between the oscillator and price action often signals potential reversals.
4. Combining with Other Indicators
The Stochastic Oscillator works effectively with trend indicators like moving averages or MACD to confirm signals.
Advantages of the Stochastic Oscillator
- Ease of Use: Clear buy and sell signals.
- Versatility: Effective across all timeframes.
- Accuracy in Ranges: Excellent for spotting reversals in sideways markets.
Limitations of the Stochastic Oscillator
- False Signals: Common in trending markets.
- Sensitivity to Settings: Requires optimization for different instruments and timeframes.
- High Volatility Challenges: Can produce erratic signals in highly volatile conditions.
Trading Example with the Stochastic Oscillator
On an hourly EUR/USD chart, the oscillator crosses above 20, signaling a buy opportunity. Simultaneously, the price is at a support level. Enter the trade and exit when the oscillator reaches 80, locking in profits.
Conclusion
The Stochastic Oscillator is a versatile tool suitable for various market conditions. It helps traders identify entry and exit points, overbought or oversold conditions, and assess the strength of current trends.
Like any tool, it works best when combined with other indicators. With the right approach, the Stochastic Oscillator can become an invaluable part of your trading arsenal.