


Learn Trading for Free and Without Registration
An Online Glossary to Study Trading Independently
Dollar Smile Theory: What Is It and How Does It Work?
The Dollar Smile Theory: What It Is and How It Works
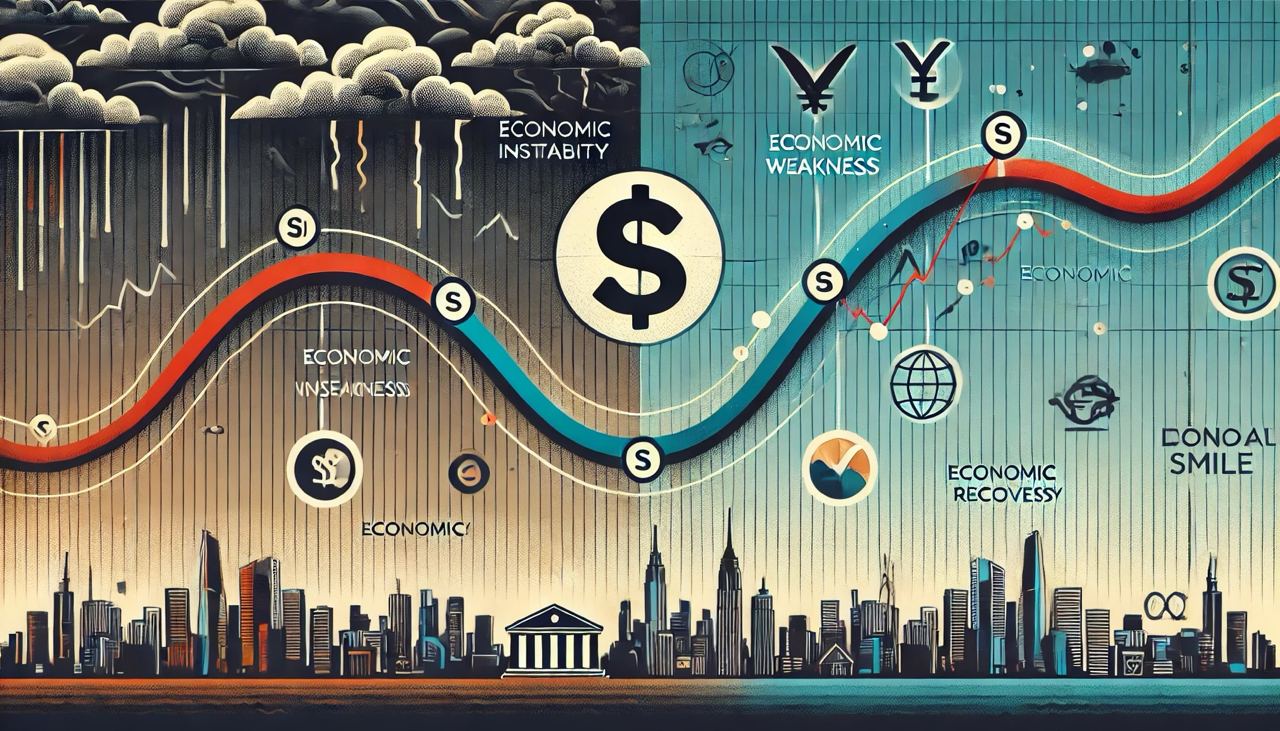
The U.S. dollar often exhibits surprising behavior, strengthening during both economic downturns and periods of growth. To explain this phenomenon, Steven Yen, a former currency strategist and economist at Morgan Stanley, introduced the Dollar Smile Theory in 2001. This theory outlines three key scenarios that describe the behavior of the U.S. dollar, forming a "smile" shape when visualized on a graph.
The Essence of the Dollar Smile Theory
The Dollar Smile Theory illustrates three distinct phases of the U.S. dollar’s behavior:
Phase 1: Dollar Strength During Risk Aversion
On the left side of the "smile," the dollar acts as a safe-haven currency. During periods of global economic instability, financial crises, or geopolitical risks, investors move away from risky assets like equities and seek refuge in safer options, such as the U.S. dollar.
- Why it works: The dollar is considered one of the safest currencies due to its status as the world’s reserve currency, high liquidity, and the strength of the U.S. economy.
- Example: During the 2007–2008 financial crisis, the dollar appreciated significantly despite the U.S. economy being in recession.
Phase 2: Dollar Weakness Due to Poor Economic Performance
The bottom of the "smile" reflects the dollar's weakness due to poor economic fundamentals in the U.S. During this phase, the dollar loses its appeal:
- Weak GDP growth.
- Low interest rates.
- A widening trade deficit.
Investors shift to higher-yielding assets, leading to dollar sell-offs. - Example: After the 2008 crisis, as investors returned to high-yield currencies, the dollar weakened, becoming the "worst-performing currency of 2009."
Phase 3: Dollar Strength During Economic Growth
On the right side of the "smile," the dollar strengthens as the U.S. economy recovers. This phase is characterized by:
- Accelerated economic growth.
- Positive employment data.
- Expectations of Federal Reserve interest rate hikes.
With signs of recovery, the dollar becomes an attractive asset once again. - Example: In 2014, as the U.S. economy recovered post-crisis, the dollar rallied, supported by the Federal Reserve’s rate hike expectations.
Applying the Dollar Smile Theory in Financial Markets
In Forex Trading
The theory provides a framework for understanding dollar behavior based on global economic conditions:
- Phase 1: Ideal for trading safe-haven currencies like USD/JPY.
- Phase 2: High-yield currencies such as AUD or NZD tend to outperform the dollar.
- Phase 3: Long positions on the dollar become favorable.
In the Stock Market
- During Phase 1, investors may turn to defensive assets such as gold or shares of low-debt, large-cap companies.
- In Phase 3, a stronger dollar can pressure U.S. exporters as their products become more expensive internationally.
In Commodity Markets
- A stronger dollar during Phases 1 and 3 typically leads to lower prices for commodities like oil and gold.
- Conversely, a weaker dollar in Phase 2 supports commodity price increases.
In Cryptocurrency Markets
Cryptocurrencies often act as alternative assets decoupled from traditional markets:
- In Phases 1 and 2, cryptocurrencies may see increased demand amid mistrust of traditional financial systems.
- In Phase 3, a stronger dollar and rising interest rates may reduce crypto’s appeal.
How Reliable Is the Theory?
Strengths:
- Explains Long-Term Trends: The theory provides insights into how global economic events and market sentiment affect the dollar.
- Institutional Use: Widely adopted by hedge funds and institutional investors for assessing macroeconomic risks.
Weaknesses:
- Limited Short-Term Application: The theory is better suited for analyzing long-term cycles than predicting daily market movements.
- Excludes External Factors: Events like geopolitical crises or central bank interventions can disrupt expected patterns.
- Difficult Phase Identification: Identifying the economy’s position within the cycle can be challenging.
Recommendations from Ronin Academy
The Dollar Smile Theory is a valuable tool for understanding global trends and market sentiment. However, we do not recommend relying solely on this theory for investment decisions. Instead:
-
Combine with Other Analytical Methods:
Use the theory alongside fundamental and technical analysis for a more comprehensive view. -
Stay Informed on Global Events:
Monitor economic calendars and central bank decisions to contextualize the theory's implications. -
Be Flexible:
Market conditions are constantly evolving. Even well-established theories can fall short in certain scenarios.
Conclusion
The Dollar Smile Theory offers a compelling framework for analyzing the U.S. dollar’s behavior under varying economic conditions. It encourages traders and investors to evaluate macroeconomic factors, identify market trends, and prepare for potential shifts.
At Ronin Academy, we emphasize that understanding theories like the Dollar Smile is just one part of a trader's education. Success requires a thorough understanding of markets, discipline, and continuous learning.
Which Charts to Use for Analyzing the Dollar Smile Theory?
The Dollar Smile Theory doesn’t represent a specific chart pattern like "head and shoulders" or "flags." Instead, it’s a conceptual framework describing long-term macroeconomic trends and the behavior of the U.S. dollar in various global conditions. However, analyzing this theory requires using specific charts and data.
What Charts to Use for Analyzing the Dollar Smile?
1. U.S. Dollar Index (USDX)
The U.S. Dollar Index (DXY or USDX) is a key tool for tracking the overall strength of the dollar relative to a basket of foreign currencies.
- What to look for:
- Phase 1 (strength during risk aversion): A rising USDX indicates investors are seeking safety in the dollar.
- Phase 2 (weakness from poor fundamentals): USDX declines as the dollar loses its appeal.
- Phase 3 (strength during recovery): USDX begins to rise again as the U.S. economy recovers.
- Recommended timeframes: Daily, weekly, or monthly charts for long-term analysis.
2. Major Currency Pairs with the Dollar
Analyzing dollar-based currency pairs provides a detailed view of the dollar’s behavior in line with the theory.
- Examples of currency pairs:
- EUR/USD: A primary gauge of the dollar’s strength relative to the euro.
- USD/JPY: Ideal for analyzing Phase 1, as both currencies are considered safe havens.
- AUD/USD or NZD/USD: Reflective of Phase 2 when risk appetite increases and high-yield currencies strengthen.
3. Macroeconomic Indicator Charts
Analyzing global economic indicators supports identifying phases of the theory:
- U.S. GDP: Helps determine periods of growth or contraction.
- Unemployment data: High unemployment typically aligns with Phase 2.
- Federal Reserve interest rate decisions: Rate hikes often signal Phase 3.
How to Interpret the Charts?
-
Phase 1 (Dollar Strength):
- The USDX chart will show upward movement.
- Currency pairs where the dollar is the base currency (USD/JPY, USD/CHF) will rise.
- Pairs with the dollar as the quoted currency (EUR/USD, AUD/USD) will fall.
-
Phase 2 (Dollar Weakness):
- The USDX chart will decline.
- High-yield currencies like AUD or NZD will outperform the dollar.
- Commodities such as gold and oil may rise, reflecting dollar weakness.
-
Phase 3 (Dollar Recovery):
- USDX begins to climb again.
- Major currencies (EUR, JPY) will weaken against the dollar.
Recommendations for Chart Analysis
-
Use Indicators:
Add moving averages (SMA or EMA) to confirm long-term trends. -
Compare Historical Periods:
Analyze historical data to compare current market conditions with past Dollar Smile phases. -
Monitor Correlations:
- A rising USDX often correlates with falling commodity prices (e.g., oil, gold).
- These correlations may weaken during Phase 2.
Conclusion
Charts such as the USDX, major dollar-based currency pairs, and macroeconomic indicators are essential tools for analyzing the Dollar Smile Theory. However, it’s crucial to remember that this theory operates at a macro level and is best suited for long-term analysis. Combine it with other analytical methods and always consider broader economic conditions.