


Learn Trading for Free and Without Registration
An Online Glossary to Study Trading Independently
Harmonic Price Patterns
Harmonic Price Patterns: A Trader’s Guide
Harmonic price patterns are one of the most exciting methods of technical analysis, allowing traders to accurately predict potential reversals and the duration of trends. Built on Fibonacci ratios, they are complex but incredibly precise tools that help traders identify optimal entry and exit points.
Let’s dive into the world of harmonic patterns to learn about their history, key concepts, and major formations.
What Are Harmonic Price Patterns?
Harmonic patterns are chart structures that emerge due to regularities in price movement. They rely on Fibonacci ratios and consist of combinations of multiple waves or swings. The primary goal of these patterns is to help traders identify potential reversal points, known as Potential Reversal Zones (PRZ).
Unlike other analysis methods, harmonic patterns require the completion of all structural elements before drawing conclusions about reversals or trend continuation. This makes them more accurate but also demands patience and attention to detail.
The History of Harmonic Patterns
Harmonic patterns were first introduced by Harold McKinley Gartley in his 1935 book Profits in the Stock Market. He described the first pattern, later named the “Gartley Pattern.”
In the 1990s, Gartley’s theory was significantly refined by Scott Carney, who introduced patterns such as the “Bat” and the “Crab,” and clarified the construction rules. Carney emphasized the importance of Fibonacci ratios and developed the PRZ concept, making the methodology more precise.
Today, harmonic patterns are widely used in forex, stock, and commodity markets due to their versatility and effectiveness.
How Do Harmonic Patterns Work?
Harmonic patterns are constructed from several price swings (waves) that form specific geometric figures. These figures adhere to strict Fibonacci ratios, such as:
•61.8%, 78.6%, 88.6% for retracements.
•127.2%, 161.8%, 261.8% for extensions.
Each pattern consists of key points (usually labeled X, A, B, C, and D) connected by lines to form a structure. For example, in the ABCD pattern, points A, B, and C define price swings, while point D indicates a potential reversal.
Key Harmonic Patterns
1. ABCD Pattern
![]()
This is the most basic harmonic pattern and serves as the foundation for more complex structures. It consists of four points: A, B, C, and D.
•AB represents the initial trend move.
•BC is a retracement, typically 61.8% or 78.6% of AB.
•CD is the continuation, extending 127.2% or 161.8% of BC.
Usage: When the price reaches point D, traders look for confirmation to enter the market in the opposite direction.
2. Three Drives Pattern
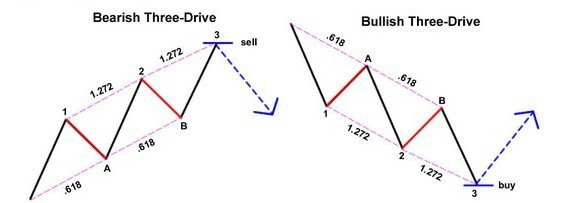
This pattern involves three consecutive price moves (“drives”), each related to Fibonacci extensions.
•The first drive ends at 127.2% of the previous swing.
•The second drive ends at 161.8%.
•The third drive completes the pattern.
Usage: Traders anticipate a reversal after the third drive and use the PRZ to enter in the opposite direction.
3. Gartley Pattern
One of the most famous harmonic patterns. Its Fibonacci ratios are:
•XA: The initial move.
•AB: Retraces 61.8% of XA.
•BC: Retraces 38.2% or 88.6% of AB.
•CD: Extends 127.2% or 161.8% of BC.
Usage: Point D is the key area to look for a reversal.
4. Bat Pattern
Similar to the Gartley but with a deeper retracement:
•AB: Retraces 38.2% or 50% of XA.
•CD: Extends 161.8% of BC.
5. Crab Pattern
Characterized by a significant extension:
•CD: Extends 261.8% of XA.
6. Butterfly Pattern
Features a full XA retracement:
•AB: Retraces 78.6% of XA.
•CD: Extends 161.8% of BC.
Advantages of Harmonic Patterns
1.Precision: Strict adherence to Fibonacci ratios reduces the likelihood of false signals.
2.Versatility: Applicable to all markets and timeframes.
3.Integration: Can be easily combined with other tools, such as support and resistance levels or candlestick patterns.
Disadvantages of Harmonic Patterns
1.Complexity: Requires a deep understanding of Fibonacci and chart analysis skills.
2.Time-Consuming: Manual construction of patterns can be tedious.
3.Dependency on Accuracy: Incorrectly identifying key points can lead to false conclusions.
Tips for Trading Harmonic Patterns
1.Wait for Completion: Always wait for the pattern to complete before entering a trade.
2.Seek Confirmation: Use candlestick patterns, volume, or indicators to confirm signals.
3.Practice: Train yourself to spot patterns on historical data.
4.Risk Management: Always set stop-loss orders as even perfect patterns can fail.
Conclusion
Harmonic price patterns are powerful tools that help traders identify high-probability entry and exit points. They demand discipline, patience, and skill, but mastering this methodology can significantly enhance your trading results.
Remember, trading is an art, and harmonic patterns are just one of the tools in your arsenal. Best of luck on your trading journey and may you find the perfect patterns!