


Learn Trading for Free and Without Registration
An Online Glossary to Study Trading Independently
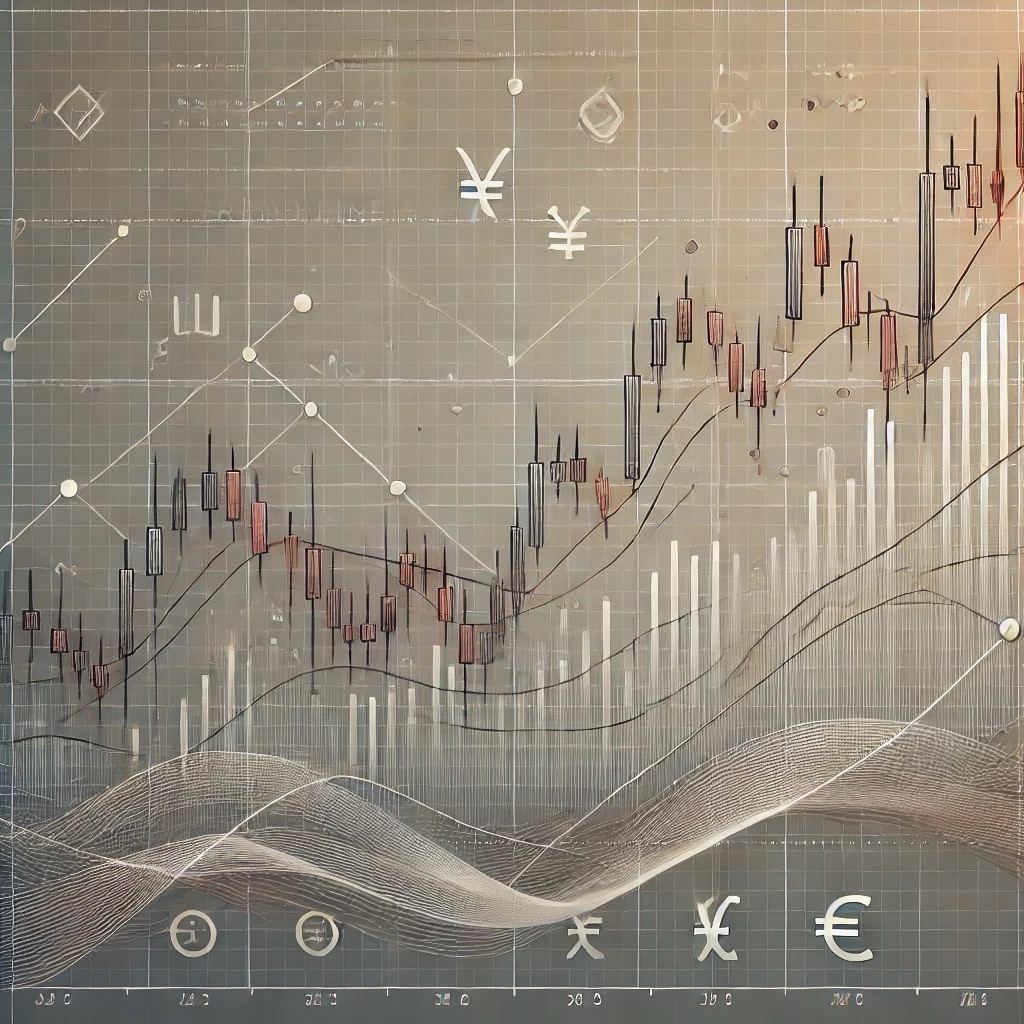
Forex Chart: Tick, Line, Japanese Candlesticks, Bars
Forex Charts: The Basics Every Trader Must Know
Forex charts provide an intuitive and informative representation of price movements over time. Similar to school graphs, the X-axis represents time, while the Y-axis shows price. There are various ways to visualize this data, each with a different level of detail.
For instance, displaying every minor price fluctuation would make a chart overly complex and hard to interpret. Price movements happen more frequently than once per second, and not all of them carry meaningful information. Therefore, choosing the right type of Forex chart is crucial for effective analysis and trading.
This article will cover the fundamental types of Forex charts that every trader should know:
- Tick Charts
- Line Charts
- Japanese Candlesticks
- Bar Charts
Tick Charts: Maximum Detail
Tick charts are the most detailed type of chart, capturing every price movement. These charts automatically appear in the order window in MetaTrader. On a tick chart, you’ll typically see two lines:
- Bid Line: Represents the price buyers are willing to pay.
- Ask Line: Represents the price sellers are asking for.
These lines move almost simultaneously, reflecting every transaction. However, their extreme level of detail limits their practical use, as MetaTrader servers only store minute-level data to avoid overwhelming storage requirements.
When to Use Tick Charts:
- Testing Automated Trading Systems: Tick data enables algorithms to simulate scenarios with high precision, ensuring realistic backtesting.
- Precise Entry Points: Tick charts are valuable for scalpers and traders operating on ultra-short timeframes.
For most traders, however, tick charts are overly detailed and better suited for specific purposes rather than everyday use.
Line Charts: Simplicity for Beginners
Line charts are the most basic type of chart, displaying price as a single line. They filter out minor fluctuations, providing a cleaner and more straightforward view. This makes them ideal for beginners learning the basics of market analysis and trading platform functionality.
Key Features of Line Charts:
- They show only the closing price for each time period.
- They are easy to read and helpful for identifying general trends.
However, line charts lack the depth needed for comprehensive market analysis. They don’t reveal intraday price movements, such as the high and low of each period, making them less effective for advanced analysis.
Japanese Candlesticks: A Trader’s Favorite
Japanese candlesticks are the most popular and versatile type of Forex chart. They offer a wealth of information about price activity within a specific time frame.
How Japanese Candlesticks Work:
- Open: The first point of the candlestick represents the price at the beginning of the time period.
- Close: The second point marks the price at the end of the period.
- Shadows (Wicks):
- The upper wick shows the highest price during the period.
- The lower wick shows the lowest price during the period.
- Color:
- A green (or white) candle indicates a price increase (close is higher than open).
- A red (or black) candle indicates a price decrease (close is lower than open).
Why Are Japanese Candlesticks So Popular?
- They provide a comprehensive view of price action, including range, volatility, and direction.
- They form patterns that can predict future market movements, such as "Hammer," "Shooting Star," and others.
Candlestick analysis has become a cornerstone of technical analysis, as detailed in Steve Nison's book Japanese Candlestick Charting Techniques.
Bar Charts: A Classic Alternative
Bar charts are another traditional method of displaying price movements. While similar to Japanese candlesticks, they use vertical lines instead of rectangular bodies to represent price ranges.
How Bar Charts Work:
- Vertical Line: Shows the full price range (high and low) during the period.
- Horizontal Ticks:
- Left tick indicates the opening price.
- Right tick indicates the closing price.
Bar Chart Features:
- They are less visually intuitive than Japanese candlesticks due to the lack of color coding.
- Some traders prefer bar charts for their simplicity and minimalistic style.
Although bar charts remain a reliable tool, Japanese candlesticks have largely replaced them due to their greater visual clarity and ease of interpretation.
Why Understanding These Charts Is Essential
A solid understanding of chart types is a foundational skill for any trader. The type of chart you choose determines how you analyze the market and make trading decisions.
- For Beginners: Line charts are a great starting point for getting acquainted with the platform.
- For Scalpers: Tick charts provide the precision needed for quick trades.
- For Professionals: Japanese candlesticks offer the most comprehensive and actionable insights into market activity.
Conclusion: Choosing the Right Chart for Your Needs
Each type of chart has its strengths and weaknesses. To succeed as a trader, you need to know when and how to use each one effectively.
These fundamental chart types lay the groundwork for deeper market analysis. As you gain experience, you can explore more advanced options, such as Heikin Ashi or Point-and-Figure charts. However, the key to success lies in mastering the basics, as they are the foundation for all future learning and trading decisions.