


Learn Trading for Free and Without Registration
An Online Glossary to Study Trading Independently
Japanese Candlesticks - What Are They?
What is a Japanese Candlestick?
If you’re new to trading and unfamiliar with Japanese candlesticks, it’s time to get acquainted with this essential tool for analyzing price movements!
Japanese candlesticks are a method of visualizing price movements over a specific time period and are widely used by traders around the globe. Their popularity stems from their ability to provide clear and detailed information about market behavior. Let’s delve into the history and structure of Japanese candlesticks to understand why they are so valuable.
The History of Japanese Candlesticks
The origin of Japanese candlesticks dates back to the 17th century when rice was Japan’s primary traded commodity. A rice exchange existed to monitor price fluctuations, and Japanese merchants developed a method to track these changes, which eventually became known as "Japanese candlesticks."
In the 20th century, an American trader and analyst named Steve Nison studied this technique and introduced it to the Western world. His efforts made candlestick analysis one of the foundational tools in technical analysis. Today, Steve Nison is often referred to as the "King of Japanese Candlesticks."
The Structure of a Japanese Candlestick
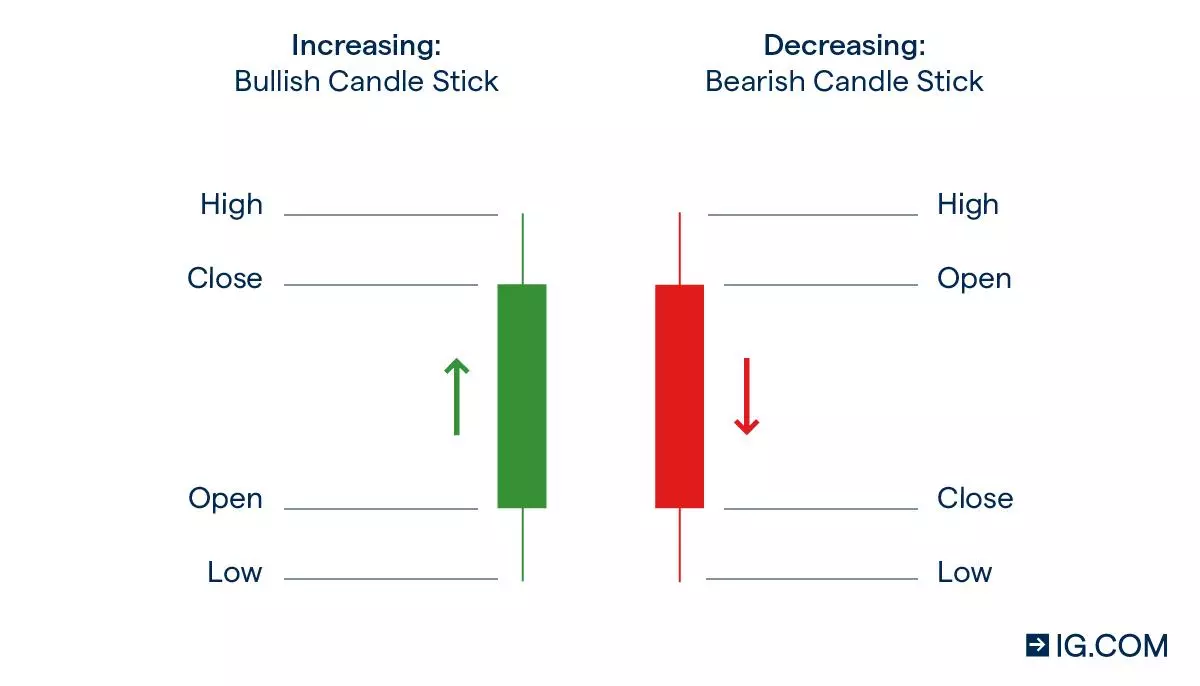
A Japanese candlestick represents price movement over a specific time frame—this could be a minute, an hour, a day, or even a week. Each candlestick contains four key data points:
- Opening Price (Open): The price at the start of the time period.
- Closing Price (Close): The price at the end of the time period.
- High Price (High): The highest price reached during the period.
- Low Price (Low): The lowest price reached during the period.
Components of a Candlestick:
-
Body of the Candle (Body):
- A rectangular section between the opening and closing prices.
- If the closing price is higher than the opening price, the candle is usually hollow or white (bullish candle).
- If the closing price is lower than the opening price, the candle is filled or black (bearish candle).
-
Wicks or Shadows:
- Thin lines extending above and below the candle’s body.
- Upper Wick: Represents the highest price during the period.
- Lower Wick: Represents the lowest price during the period.
Why Are Japanese Candlesticks Important?
- Clarity: Candlesticks visually highlight critical price levels, such as opening, closing, highs, and lows.
- Versatility: They can be applied to any time frame, from one-minute charts to monthly charts.
- Functionality: Japanese candlesticks are used to analyze trends, identify support and resistance levels, and recognize patterns for trend reversals or continuations.
Key Terms and Basic Concepts
- Bullish Candle: A hollow or white candle indicating an increase in price (closing price is higher than opening price).
- Bearish Candle: A filled or black candle indicating a decrease in price (closing price is lower than opening price).
- Upper Shadow: The highest price during the period.
- Lower Shadow: The lowest price during the period.
- Candle Body: The difference between the opening and closing prices.
Conclusion
Japanese candlesticks form the foundation for understanding price movements across all markets, whether Forex, stocks, or cryptocurrencies. This tool is essential for making informed trading decisions and is a must-learn for every trader.
Now that you understand the basics, start analyzing candlesticks on charts and discover how they can become your key to successful trading!