Learn Trading for Free and Without Registration
An Online Glossary to Study Trading Independently
Parabolic SAR indicator
Parabolic SAR: History, Features, and Practical Application in Trading

Parabolic SAR is one of the most recognizable indicators in technical analysis, designed to identify and evaluate trends. Created in 1978 by Welles Wilder, it has become a staple among trading tools and remains relevant to this day. SAR stands for Stop and Reverse, reflecting its core functionality: signaling potential trend reversals.
This article delves into the history of Parabolic SAR, its operating principles, practical uses, and both advantages and limitations.
History and Development
Welles Wilder, the creator of Parabolic SAR, was a mathematician and engineer. His contributions to technical analysis include well-known tools like the Relative Strength Index (RSI), Average True Range (ATR), and the Average Directional Index (ADX). When developing Parabolic SAR, Wilder aimed to create an indicator that could not only identify trends but also help traders exit positions at the right time.
How Parabolic SAR Works
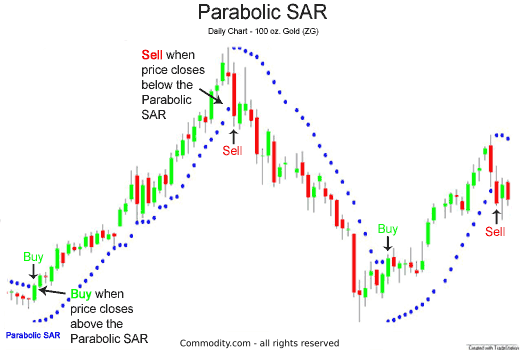
Parabolic SAR appears on charts as dots placed either above or below the price:
- Dots below the price indicate an uptrend.
- Dots above the price signal a downtrend.
The indicator is calculated based on price and an acceleration factor (AF). AF increases with each new extreme price level, bringing the dots closer to the price as the trend strengthens.
- Step (Step): The default value is 0.02, determining how quickly the dots approach the price.
- Maximum (Maximum): The default value is 0.20, setting the cap on the AF to prevent it from moving too close to the price.
Key Signals and Interpretation
1. Trend Identification
Parabolic SAR excels at identifying trends in their early stages.
- Dots below the price signify the start of an uptrend.
- Dots above the price indicate a downtrend is forming.
2. Exit Points
Parabolic SAR is highly effective for setting exit points. When the price crosses the dots, it signals a potential trend reversal or correction.
3. Trend Strength
The distance between the dots and the price reflects the trend's strength:
- A wider gap indicates a strong trend.
- Narrowing gaps suggest the trend is losing momentum.
Using Parabolic SAR in Trading
1. Trading with the Trend
Parabolic SAR is ideal for entering trades at the start of a trend and holding positions until the trend ends.
- In an uptrend: Dots below the chart suggest opening long positions.
- In a downtrend: Dots above the chart indicate short positions.
2. Take Profit and Stop Loss
Traders can use Parabolic SAR dots as dynamic stop-loss levels, trailing the stop as the price moves in their favor.
3. Multi-Timeframe Analysis
On longer timeframes, Parabolic SAR identifies major trends, while shorter timeframes allow for precise entries.
Combining Parabolic SAR with Other Indicators
1. Parabolic SAR + MACD
MACD helps confirm the trends signaled by Parabolic SAR. For instance:
- Dots below the chart + MACD line crossing above the signal line = strong bullish signal.
- Dots above the chart + MACD line crossing below the signal line = confirmed bearish trend.
2. Parabolic SAR + ADX
ADX assesses trend strength and complements Parabolic SAR.
- A high ADX value (>25) confirms a strong trend, reinforcing the signals from Parabolic SAR.
Advantages of Parabolic SAR
- Simplicity: Easy to understand and use, even for beginners.
- Trend Identification: Effectively highlights the beginning of trends.
- Dynamic Stop-Loss: Provides adjustable levels for managing risk.
Limitations of Parabolic SAR
- Inefficiency in Sideways Markets: The indicator generates many false signals during consolidations.
- Dependency on Parameters: Standard settings may not be suitable for all markets.
Trading Example with Parabolic SAR
Let’s look at an example:
On the daily chart of EUR/USD, Parabolic SAR shows dots below the price, indicating an uptrend. You open a long position, set a stop-loss at the level of the dots, and trail it as the price moves higher. When the dots flip above the price, signaling a trend reversal, you close the position, securing your profit.
Conclusion
Parabolic SAR is a simple yet powerful tool for analyzing trends and managing trades. It is most effective in trending markets, helping traders identify both entry and exit points. For best results, use it in combination with other indicators to filter out false signals and enhance decision-making.


