Learn Trading for Free and Without Registration
An Online Glossary to Study Trading Independently
COT Trading Strategy
COT Report: A Long-Term Tool for Traders
The weekly COT report is a valuable resource for traders focused on long-term strategies. It can serve as a reliable indicator of market sentiment.
You might wonder:
"How can I turn this detailed report into a useful indicator to make profits in the forex market?"
One effective approach is to track extremely long or extremely short positions.
Why Does This Matter?
When the market is overloaded with long positions, there’s hardly anyone left to buy the currency.
And if everyone is holding short positions? There’s no demand for selling either.
Think of it like a road leading to a dead end. What happens when you can’t move forward anymore? The only way is to turn around and go back.

EUR/USD: An Example on the Chart
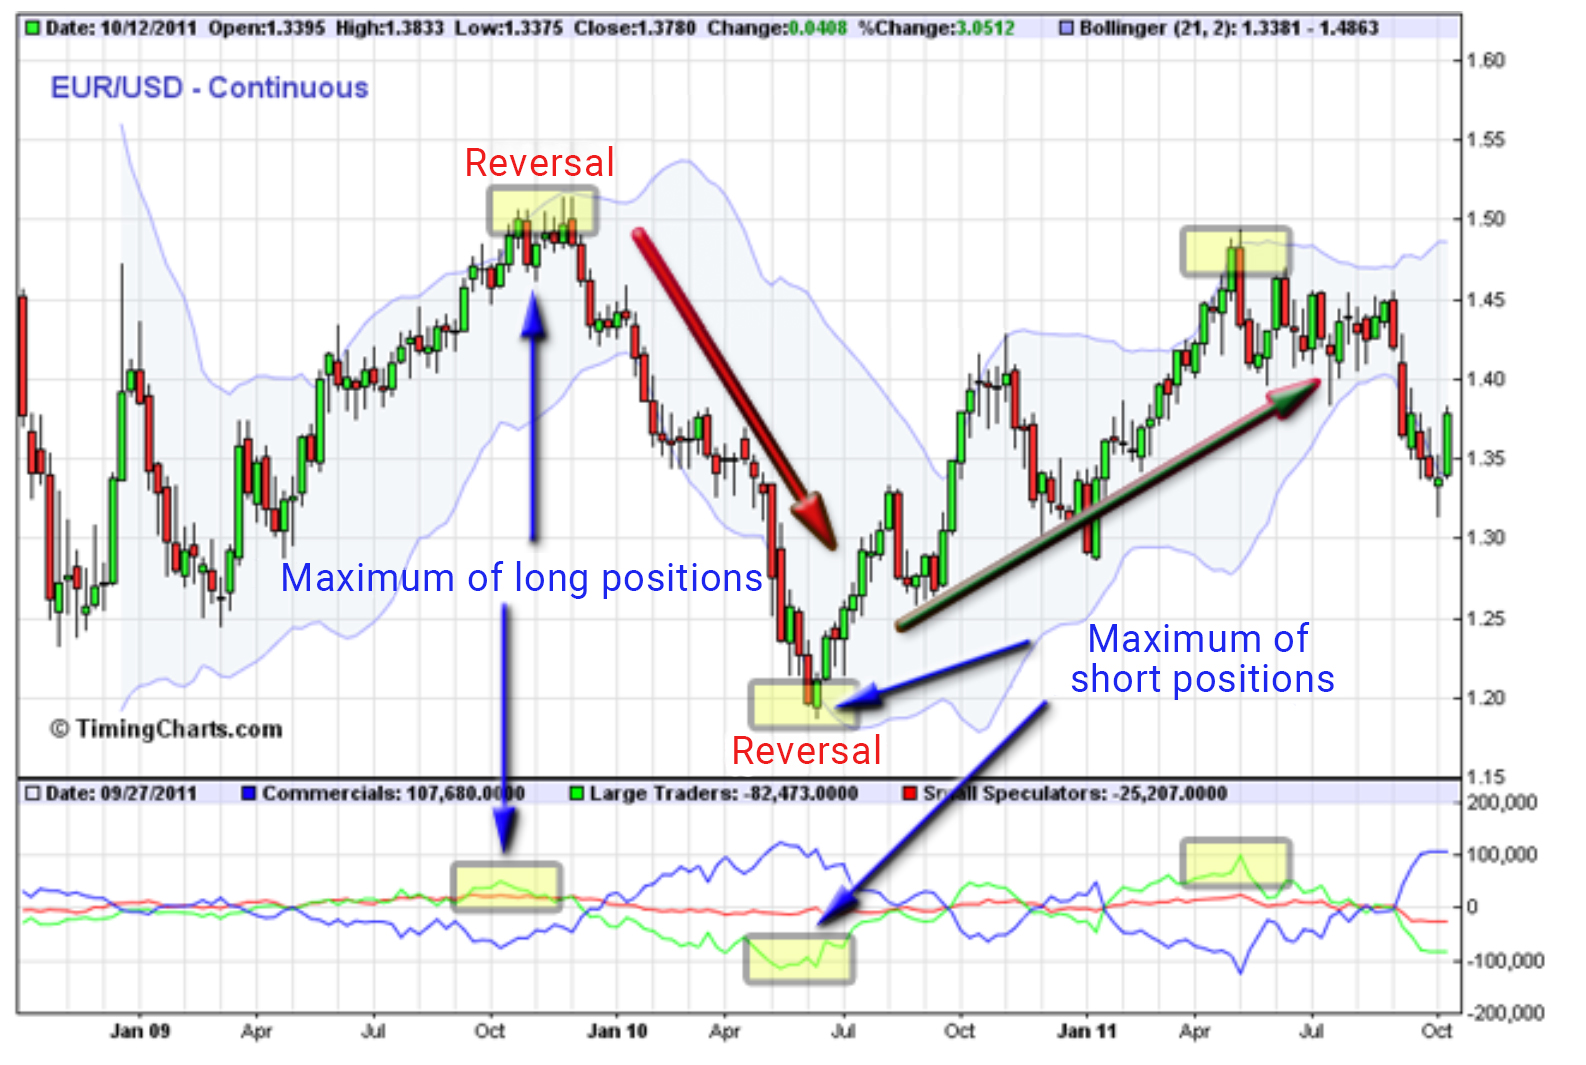
(Image Description)
The top chart shows the price movement of the EUR/USD pair. The bottom chart displays futures positions on the euro, divided into three groups:
- Hedgers (blue line).
- Large Speculators (green line).
- Small Speculators (red line).
At this stage, we’ll ignore the positions of hedgers, as their primary goal is to minimize risk. Instead, we’ll focus on small speculators and large players, who aim to make a profit.
How It Works in Practice
Let’s take a look at the situation from late 2009 to mid-2010.
- From October 2009 to July 2010, the EUR/USD pair declined, coinciding with an increase in short positions held by large speculators (green line).
- By the end of June 2010, the volume of short positions had reached 111,945, prompting a wave of euro futures purchases.
The result? Over the following year, the net value of euro futures positions turned positive, and the EUR/USD pair climbed from 1.2000 to 1.4900.
In May 2011, just before a reversal, net long positions reached 99,516. Shortly after that, the EUR/USD pair began to decline again.
How Could You Have Profited?
By using the COT report as an indicator, a trader could have captured two major market moves:
- From November 2009 to July 2010: Selling EUR/USD at 1.5000 could have yielded around 3,000 pips in profit.
- From July 2010 to May 2011: Buying EUR/USD at 1.2000 could have earned an additional 2,900 pips.
The Bottom Line: 5,900 Pips from Two Moves
If you had caught just these two market swings using the COT report as a sentiment indicator, you could have made 5,900 pips in total.
Isn’t that an impressive result for a tool that’s freely available to all traders?


