


Learn Trading for Free and Without Registration
An Online Glossary to Study Trading Independently
Trend Lines
What Are Trend Lines and How to Use Them?
According to one of Dow Theory's core principles, markets do not exist in chaos but move in cycles, each with a clear direction. Even currency pairs that appear to be in prolonged consolidation can be broken down into directional waves, particularly on four-hour timeframes. This reflects the fact that buyers or sellers dominate at different intervals, shaping market trends. Such directional movements are called trends.
In the context of wave theory, the price movements forming the trend are called impulses, while the opposing movements are referred to as corrections. Understanding how to identify trends and use trend lines is not just a basic skill but a critical tool for making informed trading decisions.
Why Is It Important to Trade with the Trend?
There’s a well-known saying in trading: “The trend is your friend.” This highlights that trading in the direction of the trend is generally safer and more profitable than going against it. Let’s break down why this is true by examining the nature of impulses and corrections:
-
Impulses
- These are the primary drivers of a trend.
- They are clearly visible on the chart, characterized by strong momentum and minimal pullbacks.
- A trader entering during an impulse can quickly gain profits as the price moves significantly in the trend’s direction until hitting a key support or resistance level.
-
Corrections
- Corrections are counter-trend movements that are less predictable.
- They can take various forms, become increasingly complex, and stretch over extended periods.
- Trading corrections carries higher risks as it’s difficult to determine when they will end.
Trading against the trend often leads to prolonged drawdowns, frustration, and stress, as well as frequent changes in trading plans. This is why experienced traders prioritize identifying trend movements and following them.
How to Draw Trend Lines
Trend lines are among the simplest tools in technical analysis, but their correct application requires some practice. Follow these three key steps to draw trend lines accurately:
-
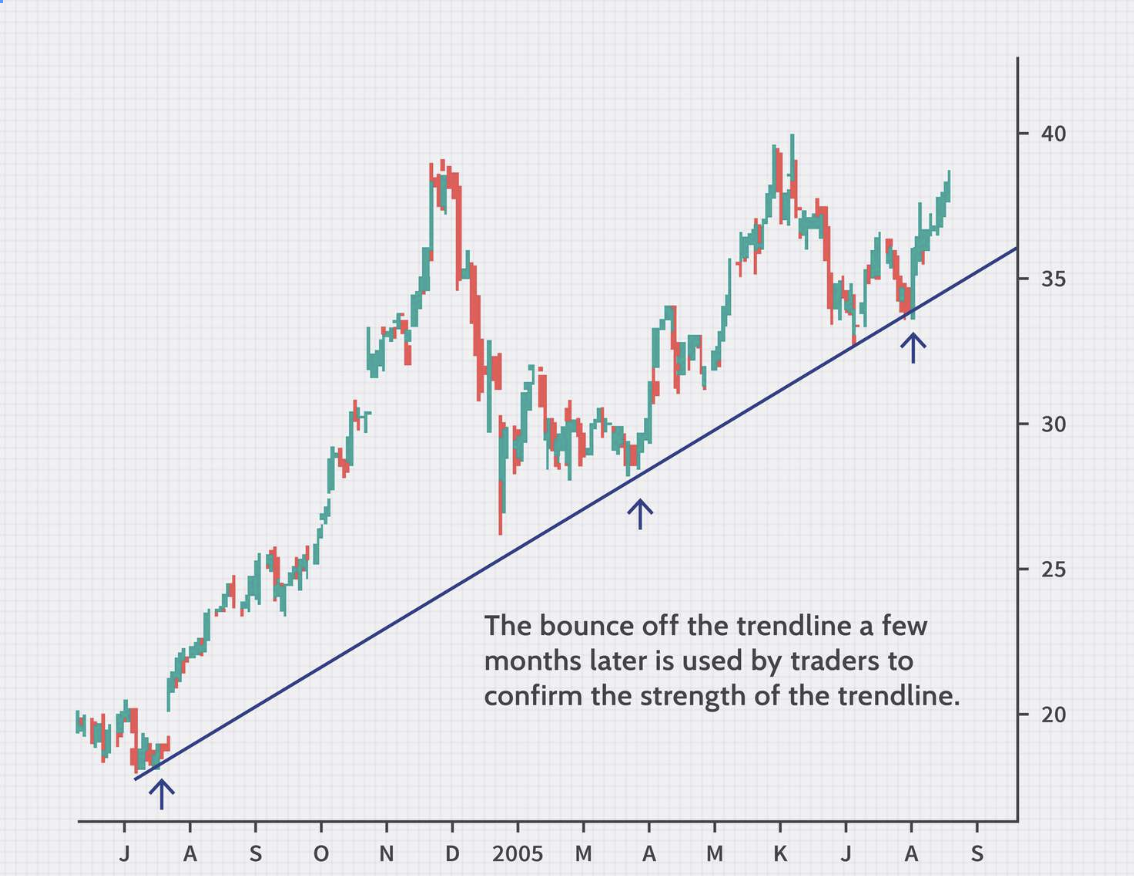
Identify the First Point
- This is the reversal point where the market shifts from one trend to another.
- For example, when a bearish trend reverses to a bullish trend, this point marks the beginning of the new movement.
-
Locate the Second Point
- This is where the first wave of the new trend ends, often followed by a correction.
- It provides an initial clue about the market’s potential direction.
-
Find the Third Point
- This critical point confirms the trend’s continuation.
- Once the price rebounds from this level, you can draw a trend line that reflects the market's trajectory.
Tips for Drawing Effective Trend Lines
-
Avoid Very Short Intervals
Trend lines drawn on lower timeframes like M1 or M5 often give unreliable signals. It’s better to work with timeframes from M15 and above. -
Maintain Adequate Distance Between Points
Points 1 and 3 should be reasonably spaced apart to ensure the trend line is meaningful and less prone to false signals. -
Assess the Depth of Corrections
Corrections that are too shallow between points 1 and 2 might indicate a weak trend, making the trend line less reliable.
Using Trend Lines in Practice
-
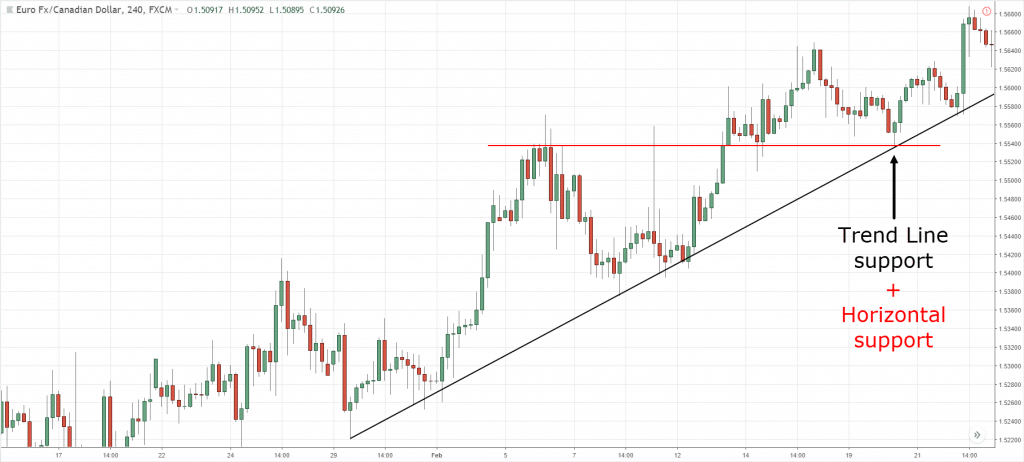
Entry Points
Trend lines often act as dynamic support or resistance levels. When the price approaches a trend line, traders can enter positions based on the expectation of a bounce. -
Stop-Loss Placement
Stop-loss orders can be placed slightly below (for long positions) or above (for short positions) the trend line to minimize losses in case of unexpected movements. -
Evaluating Breakouts
If the price breaks through a trend line and closes beyond it, this might signal a potential trend reversal. However, traders should wait for confirmation before acting.
Breakouts and Retests
Trend lines are eventually broken, often after multiple tests. When a breakout occurs, it’s crucial to wait for the candle of the current timeframe to close on the opposite side of the line before taking action. This avoids being misled by false breakouts, where the price briefly moves beyond the line but quickly returns.
After a breakout, a retest of the trend line is common. The price may return to the broken line, touching it once more before continuing in the new direction. Retests offer opportunities to enter trades at more favorable prices.
Scaling Trend Lines Across Timeframes
Trend lines can be drawn on various timeframes. Beginners should start with higher timeframes, such as weekly or monthly charts, to understand the broader market context. This approach helps:
- Differentiate between trends and corrections.
- Anticipate areas where the price might slow down or accelerate.
- Align trading plans with the overarching market structure.
Conclusion
Trend lines are versatile tools that help traders identify market direction, pinpoint entry and exit points, and manage risk. Although they may appear simple, their correct usage requires practice and attention to detail.