


Learn Trading for Free and Without Registration
An Online Glossary to Study Trading Independently
Elliott Wave Theory
Elliott Wave Theory: History, Basics, and Modern Application
The Elliott Wave Theory is a unique method of analyzing financial markets that views price movements as a result of changing trader sentiment. Based on the concept of fractals and cyclicity, this theory remains one of the most complex yet effective methodologies in technical analysis. Let’s explore its origins, principles, and relevance in modern trading.
History of Elliott Wave Theory
Ralph Nelson Elliott, an accountant and market analyst, dedicated his time in the 1920s and 1930s to studying market data. His work began when health issues forced him to halt his active career. With an analytical mindset, Elliott noticed recurring price movement patterns while reviewing over 75 years of historical data.
In 1938, after gathering sufficient evidence, he published the book “The Wave Principle”, where he explained his theory. Elliott argued that market movements, often perceived as chaotic, actually followed specific patterns.
Core Principles of Elliott Wave Theory
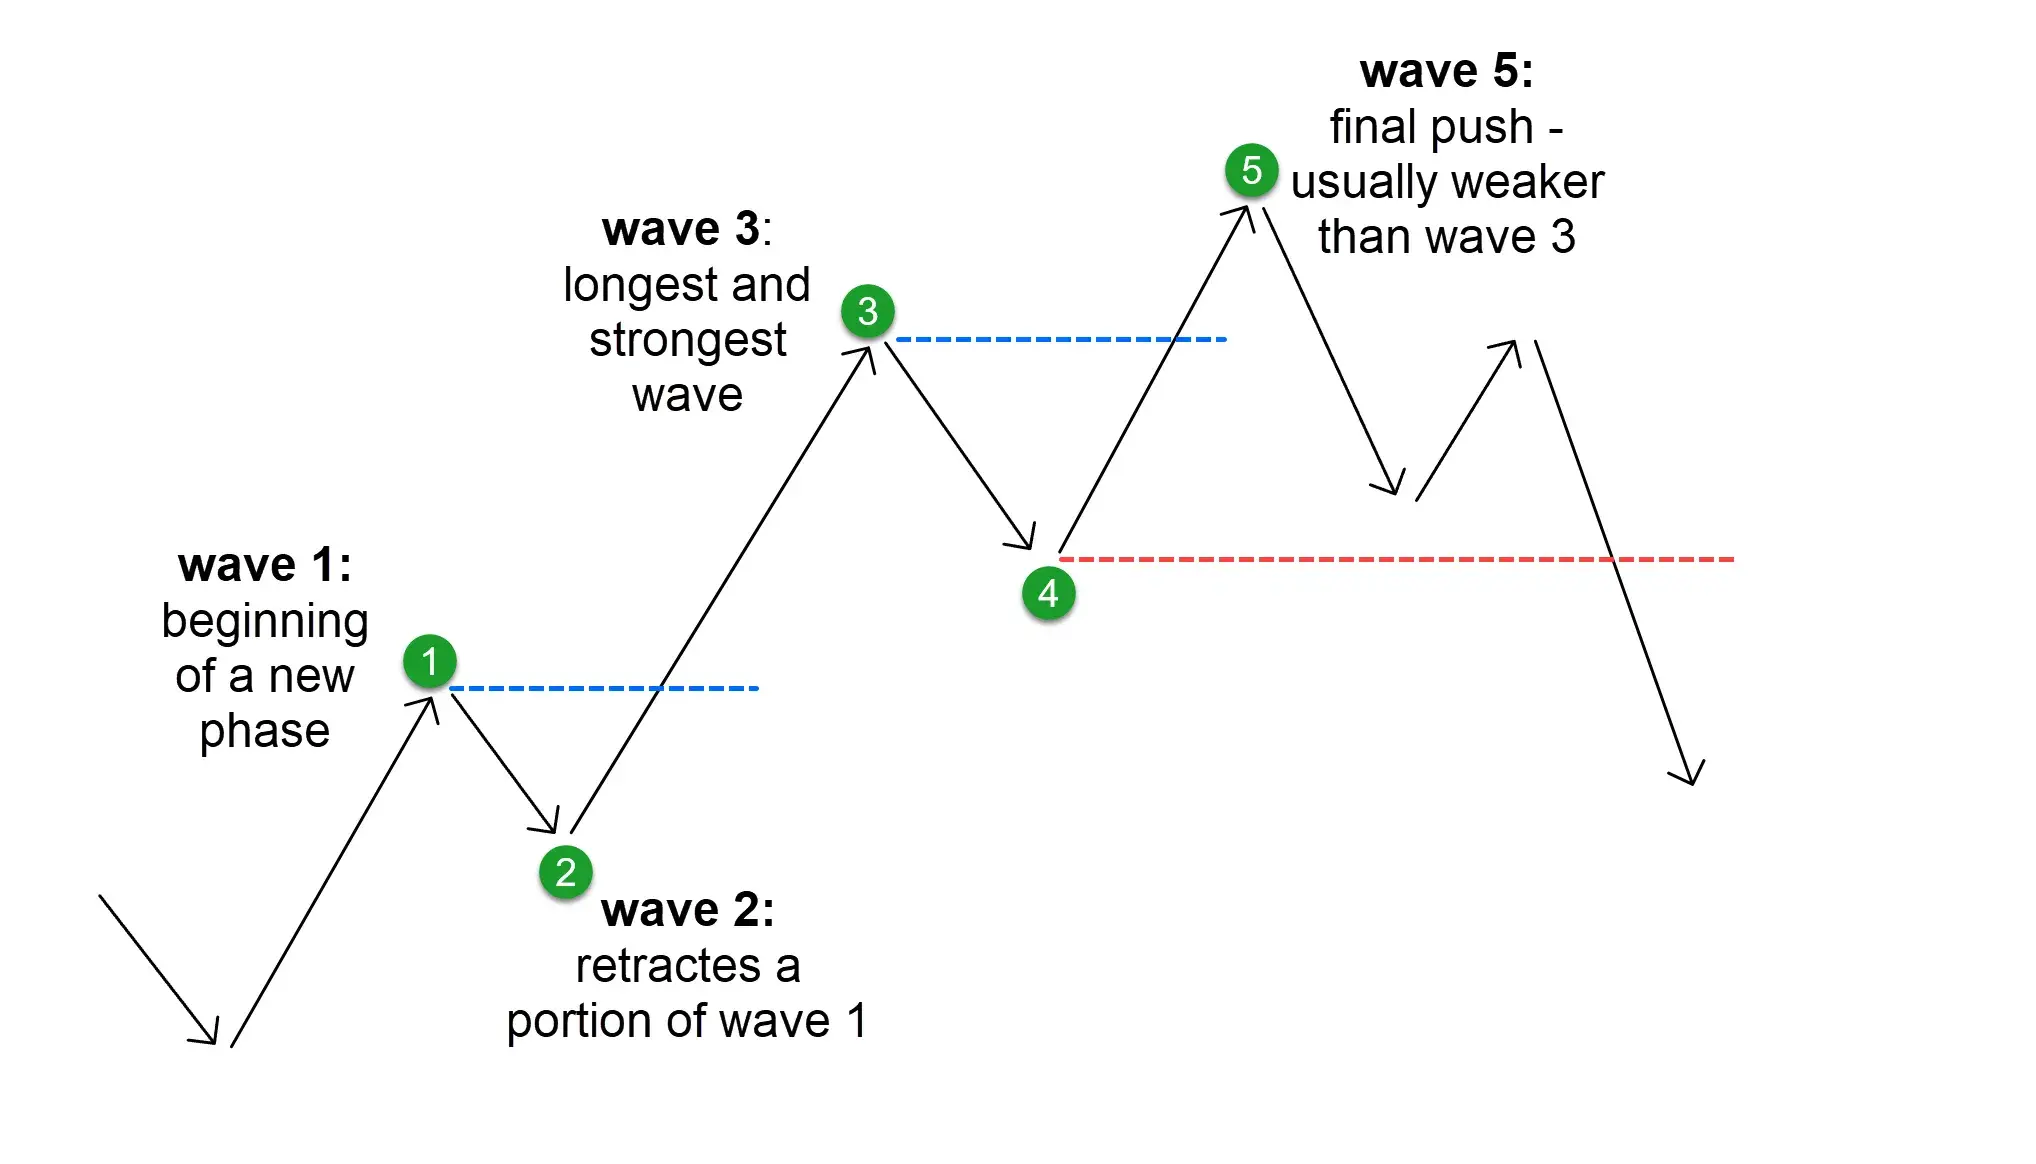
According to Elliott, markets move in recurring cycles that can be divided into:
•Impulse Waves: Move in the direction of the main trend.
•Corrective Waves: Retrace against the main trend.
Each large wave consists of smaller waves, also adhering to these rules, forming a fractal structure. The primary pattern includes 8 waves:
•5 impulse waves (in the direction of the trend).
•3 corrective waves (against the trend).
Fractality in Elliott Waves
One of the key features of the theory is its fractal nature. This means any wave can be broken down into smaller waves that mimic the structure of the larger one.
Examples from nature:
•Snowflakes: Each segment mirrors the overall design.
•Lightning bolts: Zigzagging paths replicate the broader lightning structure.
Application of Elliott Wave Theory
Elliott devised a system to identify entry and exit points based on the completion of wave structures. This helps traders:
•Forecast price reversals.
•Identify support and resistance levels.
•Plan precise entry and exit points.
Indicators Based on Elliott Wave Theory
Modern traders leverage several tools inspired by Elliott Wave Theory:
1.Elliott Wave Oscillator (EWO): Identifies trend phases.
2.Fibonacci Retracement and Extension: Measures correction depths and potential targets.
3.ZigZag Indicator: Automatically identifies waves on charts.
4.Automated wave scanners: Analyze the market in real-time, saving traders time.
Relevance of Elliott Wave Theory Today
Despite its complexity, the Elliott Wave Theory remains widely used, particularly when combined with other analytical methods:
•On the forex market, it helps pinpoint currency pair reversals.
•In stocks and cryptocurrencies, it is employed to identify long-term trends.
•Indicators derived from the theory are integrated into popular platforms like MetaTrader and TradingView.
Criticism and Limitations
While popular, the theory has its drawbacks:
•Interpretation difficulty: Different traders may analyze wave phases differently.
•Dependence on subjective analysis: Significant experience is required.
•Trend market dependency: Less effective in ranging or flat markets.
Conclusion: Ralph Elliott’s Legacy
The Elliott Wave Theory revolutionized technical analysis. Its complexity is offset by its precision in forecasting, and its fractal structure allows for application across all timeframes.
Modern tools have automated analysis, making the theory more accessible to beginner traders. However, success in its use depends on experience and the ability to view the market within a global context.
Ronin Academy Tip: Study the Elliott Wave Theory, but don’t forget to combine it with other tools like Fibonacci levels, candlestick patterns, and trend indicators. This approach will help you build a balanced trading strategy and improve your chances of success.